|
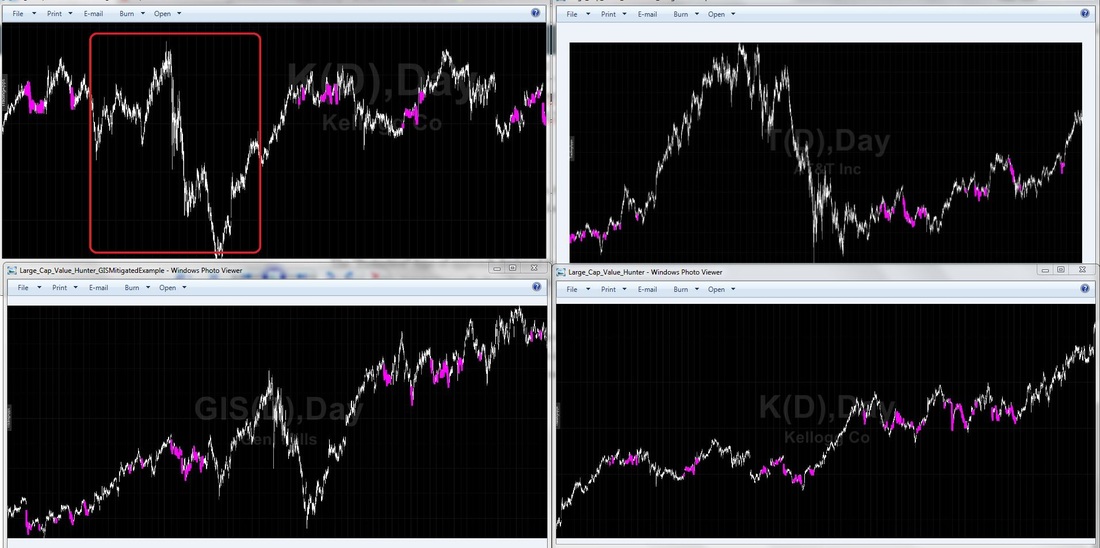
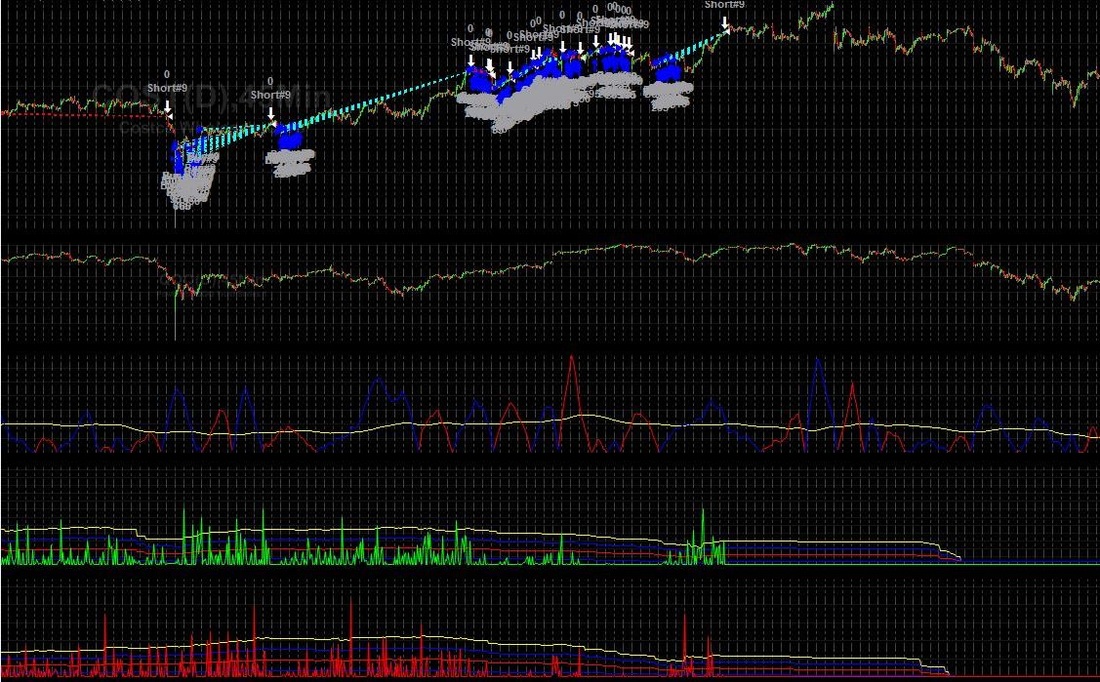
In this post, Id like to discuss a topic of Human & Group behaviors and how they are relative to strategic & conceptual development, which has been a common topic in forums and conversations among quants/developers/traders. As we know, the "markets" are a collection of behaviors, actions, sentiment/feelings, which are supported by measurable statistics, news & reports, fundamental structures. Simply stating, sometimes markets behave logically and illogically, accurately reflecting the humans who trade them and the world/collective, in both characteristics/patterns & randomness. Behavioral Finance is nothing new, and has many different applications to help one extract useful information. However, in my opinion, there is one human/individual & group behavior/action/view/strategy/etc which stands head and shoulders above the rest. One which paints a clear picture with great specificity of underlying or an under-toe of sentiment & action. Ask yourself a few simple questions What beliefs & actions are commonly taken by large firms/funds/asset managers to reduce risks. Under declining fundamentals, bearish sentiment, overbought technicals, and/or increasing volatility etc? What beliefs & actions are commonly taken with positive fundamentals, decreasing volatility, and/or gaining pos/bullish sentiment? 3. Next, What specific actions/strategies are deployed to Mitigate Risks, and to exploit growth? The answers are very clean and simple. RISK MITIGATION STRATEGY = Rebalance Portfolio into a higher % of High Quality Blue Chip Stocks & Bonds. (When a negative sentiment/metrics are acted upon). GROWTH STRATEGY = Rebalance Portfolio into a higher % of Growth Stocks. (When a positive sentiment/metrics are acted upon). *When growth strategy has a higher return potential then the amount reduced by RM strategy + Risk mitigated......OR When the amount reduced by RM strategy + potential gains outweighs the potential return from Growth strategy... This we will call "the RP method" ( Return vs Protectionism). The graphs above are a proprietary analysis method, which seeks to find "Value" of a certain type of asset, under both strategies deployed in the RP Method. The underlying concept has a organic method to NOT seek value/entry signals, during extreme negative sentiment / downward bias, as shown in 3 of the 4 graphs. Our method to identify the RP Method is to analyze a specific group of BC stocks. Here are a few of the Blue Chip Stocks such as, but not limited too: JNJ, PG, KMB, WMT, K, GIS, T, VZ, MSFT, MCD, KO, KFT, DG, DLTR, MMM, COST, MRK, CP Return and Protectionism strategies are very noticeable, if you know what your looking for, and knowing which is deployed.... is knowing the overall sentiment of "Smart Money". Simply, It all breaks down to this: If Smart Money has Bearish Sentiment, they invest into High Quality BC's & Bonds. If Smart Money has a Bullish Sentiment, they invest into Growth Stocks. This is a very powerful human/group behavior...which can be used as a Foundation for a simple, but robust trading &or investing strategy. By comparing these stocks vs "The Collective", you can find when they are Over-performing, Under-performing, Over bought, Over sold, @value, and/or include Buy & Sell Volume analysis to seek further specificity, rather then simply analyzing "Close" price. "The Collective" acts much like a moving average, but with more magnetic properties then a typical SMA/XMA applied to Xprice. "The Collective" in this instance would be "SPY", because its a pure reflection of actions taken relative to sentiment/analysis, encompassing all major sectors (ie overall average of market sentiment/action). Therefore, the SPY acts as a supporting or resisting mechanism, and not simply some generic moving average, or a perspective of singularity (individual stocks or secular analysis). Our concepts deploy specific models for different market environments, under the umbrella of these combinations:
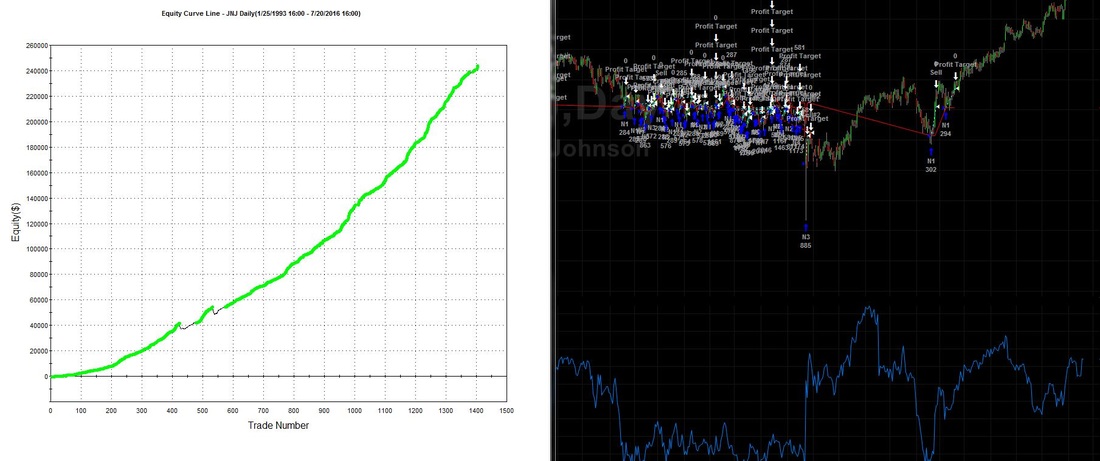
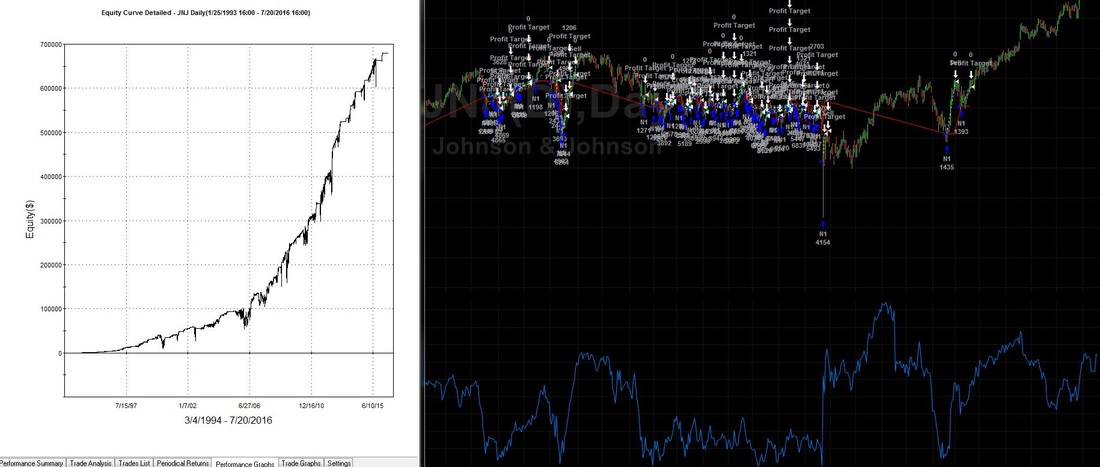
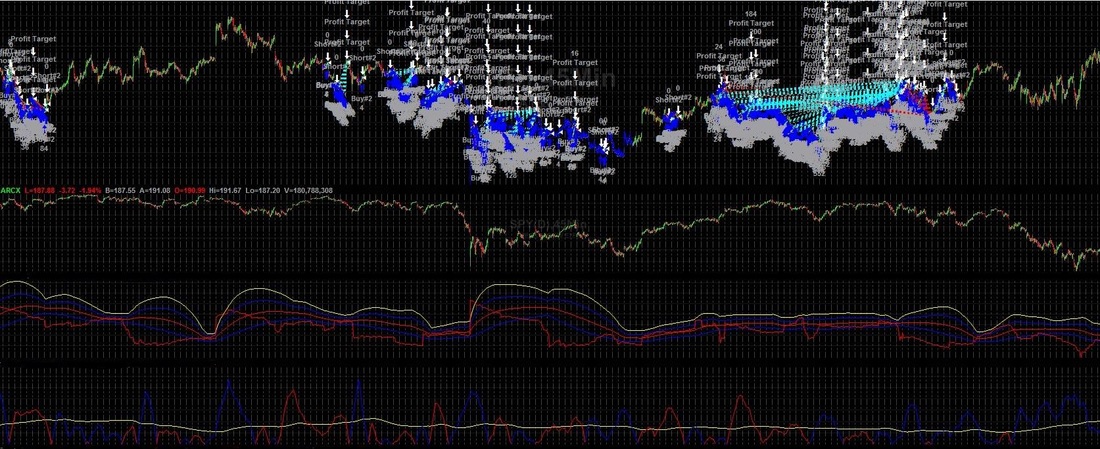
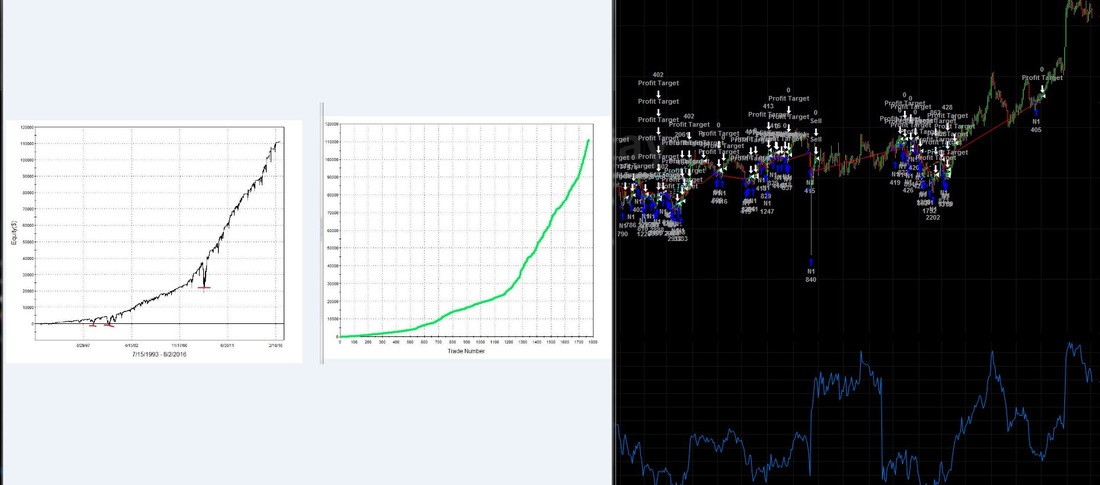
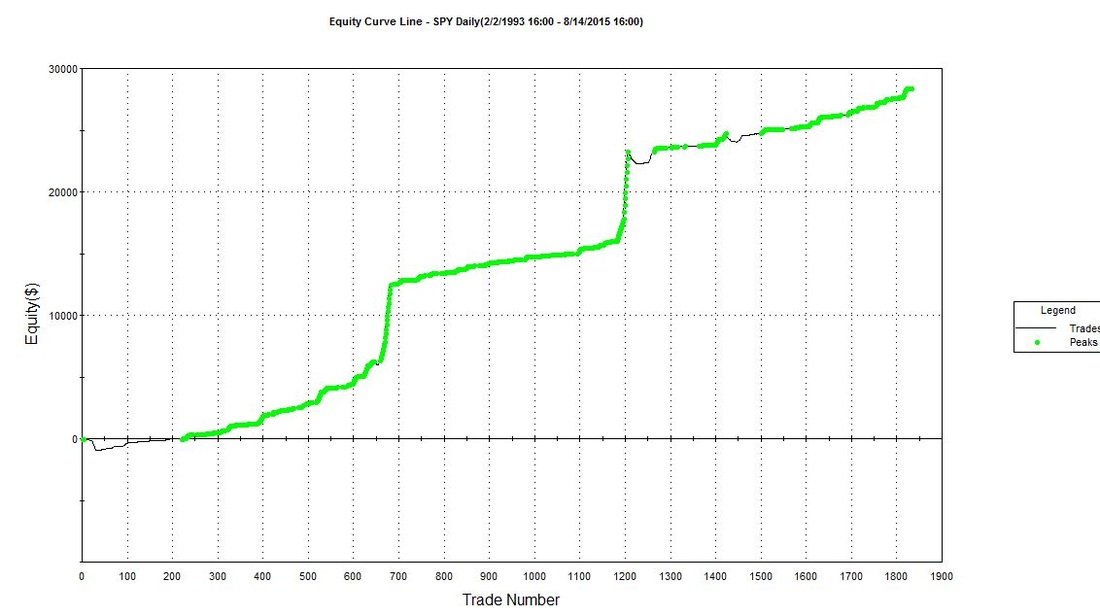
Analyzing Price data, Volume Data, Fundamental data, cyclical & seasonal patterns of Price, Volume, and common periods/thresholds/conditions of strategy change-overs/switches, analyzing multiple assets independently and as a group. There are many.....many real world, fundamental, technical, and behavioral justifications for this simple concept, including application robustness of multiple assets, frequencies, performance objectives, value selection ranges, & stress tests results. We have also included a few other proprietary techniques to improve the efficiency, but mostly to apply the concept more frequently to further improve Time/Return consistency, one of which is a proprietary technique extracted from a specific application/perspective of John Nash's Game Theory. As mentioned, Due to the robustness of the underlying concept, our algorithms based on this concept can be applied to many different frequencies, ranging from 45min - 1440min, producing a consistent range of performance metrics of many asset/time series/ performance objective / strategy value combinations . Here is a generic example of one of our Stock strategies. The equity curves below are generated by Buy/Sell executions only. Dividends & liquidity rebates are not included within the equity curves. We consider Dividends and possible Liquidity rebates icing, but are also used as a method of Mitigating Risks. We allow multiple entries per position, for every strategy. We have multiple programmed selections, which are dynamically adjusted based on proprietary analysis, that determines the optimal amount of entries & shares per entry. Meaning we do not allow some outrageous/unrealistic # of entries per position, as the main foundation of a profitable concept. All of which is a selection option available for customization. However the concepts are always developed using a single entry, to obtain the true robustness of the underlying concept & criteria. *Disclaimer: Historical performance whether live or simulated may not be indicative of future results. Trading Stocks, Options, FX, or Futures involves significant risks not suitable for all investors. Investors should only choose to invest funds he/she can afford to lose without impacting lifestyle. Price activity is not always predictable or repetitive, thus any strategy developed using historical data will be equally unpredictable. We do not guarantee our strategies or analysis methods will perform profitably and/or replicate results shown above, for any length of time. Before leasing/using our products, please consult your investment professionals, to discuss if our products are right for your risk tolerances & objectives. Price activity is not always repetitive or predictable, thus any strategy developed using historical data will be equally unpredictable. The graph below deploys a different Performance Objective & Money Management Selection then the graph above. The graph above is AT&T executions of 45min. The graph above is costco executions of 45min. The graph above shows the same concept applied to GIS, and for demonstrative purposes, I showed a setup option which has a good closed equity curve, but has a few significant open position draw downs. These draw downs / risks, would have been effectively mitigated in real time, by other strategies deployed in the portfolio, such as other stock strategies, and the Long and Short SPY ETF strategy, but also reduced by dividends. The analysis of the RP Method has implications not only for certain stocks, but also certain Indexes, we can use this analysis method to help develop a Long & Short SPY strategy, as offered within our Portfolio package.. Sometimes, taking positions when some of the stock strategies are not currently seeking a variation of value ( ie in cash). The generic graph above represents a SPY strategy option. Its objective is to slightly outperform during uptrends, however drastically outperform during increased volatility and/or downtrends.
I realize equity curves offer little insight into performance & strategy specifics, therefore we will provide detailed product & performance information for every product & package offered direct on our website. Overall, our objective is to exploit random & cyclical price movements against the directional bias, within multiple market environments. To improve Time/Return consistency, CAGR, % Time in Market, and many other risks associated with buy and hold and systematic strategies. www.optimizedtrading.com Our concepts are developed upon the foundation of Quantitative, Fundamental, & Behavioral justifications. We aim to achieve high outcome consistency, while trying to mitigate many of the factors which increase risk probabilities. That said, obviously not all risks can be mitigated. Our advanced & highly adaptive concepts are developed for Hedge Funds, CTA's, VC/PE Groups, Prop Firms, Independent or Active Asset Managers, & Sophisticated investors. I will post when these products are available, but until then, if anyone should have any questions regarding our products, please contact me [email protected] *We recommend each client thoroughly review each strategy and risk profile, and customize if needed. *Disclaimer: Historical performance whether live or simulated may not be indicative of future results. Trading Stocks, Options, FX, or Futures involves significant risks not suitable for all investors. Investors should only choose to invest funds he/she can afford to lose without impacting lifestyle. Price activity is not always predictable or repetitive, thus any strategy developed using historical data will be equally unpredictable. We do not guarantee our strategies or analysis methods will perform profitably and/or replicate results shown above, for any length of time. Before leasing/using our products, please consult your investment professionals, to discuss if our products are right for your risk tolerances & objectives. Price activity is not always repetitive or predictable, thus any strategy developed using historical data will be equally unpredictable.
0 Comments
|
Archives
March 2018
Categories |
Risk Disclosure:
Futures and forex trading contains substantial risk and is not for every investor. An investor could potentially lose all or more than the initial investment. Risk capital is money that can be lost without jeopardizing ones’ financial security or life style. Only risk capital should be used for trading and only those with sufficient risk capital should consider trading. Past performance is not necessarily indicative of future results.
Hypothetical Performance Disclosure:
Hypothetical performance results have many inherent limitations, some of which are described below. no representation is being made that any account will or is likely to achieve profits or losses similar to those shown; in fact, there are frequently sharp differences between hypothetical performance results and the actual results subsequently achieved by any particular trading program. One of the limitations of hypothetical performance results is that they are generally prepared with the benefit of hindsight. In addition, hypothetical trading does not involve financial risk, and no hypothetical trading record can completely account for the impact of financial risk of actual trading. for example, the ability to withstand losses or to adhere to a particular trading program in spite of trading losses are material points which can also adversely affect actual trading results. There are numerous other factors related to the markets in general or to the implementation of any specific trading program which cannot be fully accounted for in the preparation of hypothetical performance results and all which can adversely affect trading results.
Disclaimer: The principals of Optimized Trading understand regardless of the rigorous testing involving the development of systematic trading systems they are not infallible. Markets are dynamic and it may be necessary under special market conditions to intervene on the behalf of clients to protect their interests.
 RSS Feed