|
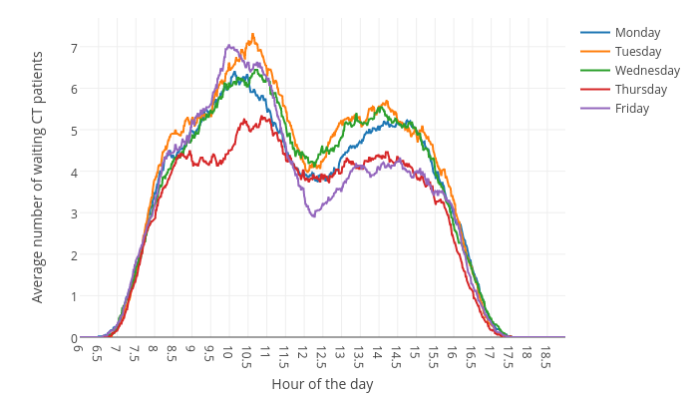
"Creatures", in this case = human or algorithm executing entries and exits. I was searching for a generic photo, that had the different days of the weeks, but in different languages, when I came across this graph, which shows historical Days of Week averages of patients waiting for CT scans....which you may think has absolutely NOTHING to do with Trading or Investing strategies...right?! WRONG! Look at the hours of the day.....humm. Im not going to dive deeply into human psychology, behavior, but if you spend some time studying Behavioral Finance, you'll find many real-world justifications for why certain days, have certain patterns, even extracting the algorithms from the equation, the human effect upon the market, therefore the human behavior upon the market is quite easily quantifiable, and to the avg investor/trader/developer, looking at days of week patterns, could be something useful to help improve your outcome, without diving deep into BF. Some simple studies/indicators can be developed, to search for each days( M, Tu, W, Th, F, Sa, Su) avg's such as:
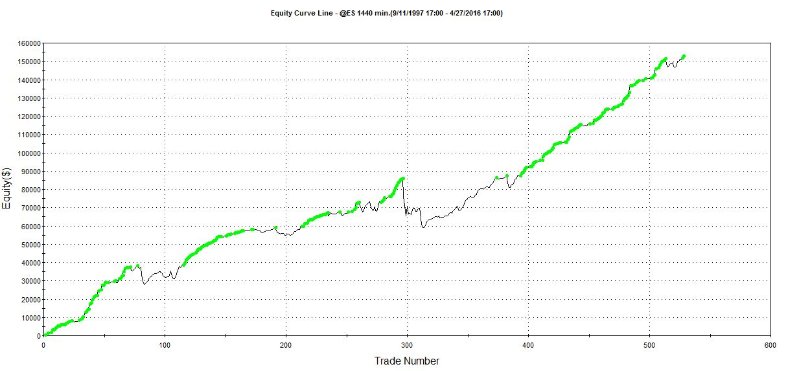
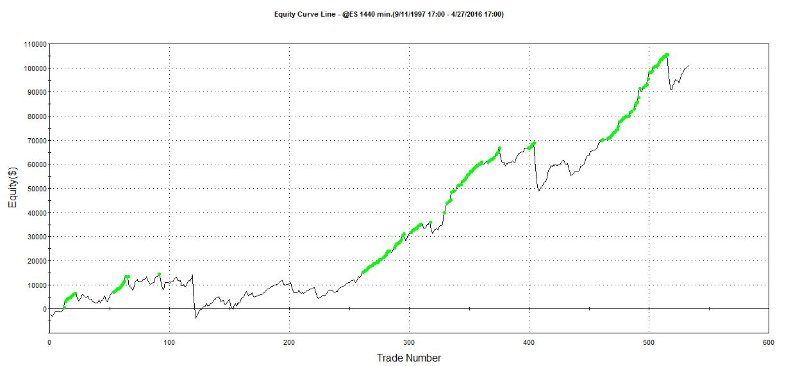
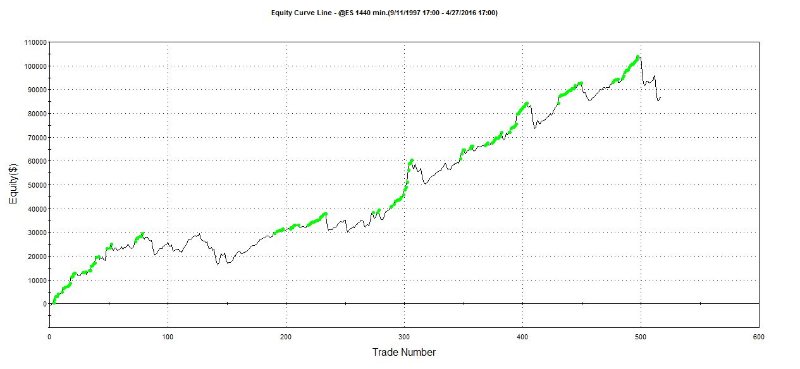
EX: The majority of humans, despise getting up early on Monday to go to work, directly after they came home from a long weekend at camp...or the beach...or the ball game. So Monday's, starts slow for you, until you get back in the "groove" of your work week....which could be after the 2nd or 3rd cup of Joe, which would lower the number of Discretionary traders. However, many traders, firms, or systems close out positions on Friday, to control risks, so they may be Jumping back in on MOnday....Now, the humans in the pits on wallstreet or CME are no different.... When you add the algorithms into the equation, they simply multiply the effect, because thats what they do.....they increase volatility, liquidity, etc. So any human behavior pattern, that has small effect on the market, is now multiplied. Also, algorithms are developed by humans, so in many instances, they reflect the desires of a human..... EX: Human Trader Brad.....is a swing trader, but he closes out all positions on Friday, so he doesnt hold any Risk over the weekend. Brad, also developed a system, that trades a different strategy, but deploys the same EOW exit logic for risk mitigation. So you have End of Day Exits ( Known as the 2 Oclock FU), and End of Week Exits. Then you have algorithms that multiply and increase price direction strength / momentum / vola / etc. So You can get massive price movements at certain times...and on certain days. I could go on for years, detailing every reason why, certain times of every day, or certain times of certain days or weeks, or certain minutes of certain hours, have these patterns. Such as Economic & News reports, Earnings releases, Session open/closes, lunch time siesta, " effects of Next bar executions", start of week, end of week, start of day, end of day, start of bar, end of bar, etc... Basically, you can create a simple strategy, that does not require Intense Quantitative analysis.....just some simple run-of-the-mill technical analysis will work fine. Here are Daily EC's from a Long Only strategy, that has Generic Four lines of code, and allows 3 entries ( 1 contract per entry). if DayOfWeek( Date ) = DayOfWk and close open then Buy next bar at close limit; if DayOfWeek( Date ) = DayOfWk and close > open then sell next bar at close limit; If mp = 1 and close > open and openpositionprofit > 0 then sell next bar at close limit; if mp = 1 and close > open and closeW > closeW[1] then sell next bar at close limit; *Disclaimer: Historical performance whether live or simulated may not be indicative of future results. Trading Stocks, Options, FX, or Futures involves significant risks not suitable for all investors. Investors should only choose to invest funds he/she can afford to lose without impacting lifestyle. Price activity is not always predictable or repetitive, thus any strategy developed using historical data will be equally unpredictable. We do not guarantee our strategies or analysis methods will perform profitably and/or replicate results shown above, for any length of time. Before leasing/using our products, please consult your investment professionals, to discuss if our products are right for your risk tolerances & objectives. Price activity is not always repetitive or predictable, thus any strategy developed using historical data will be equally unpredictable. MONDAY TUESDAY WEDNESDAY THURSDAY FRIDAY So as you can see, if you using a "Value" long only investing strategy, you could improve performance, simply by being a little more selective on which day(s) you allow entries to execute @Value.
Now, I realize these Equity Curves are not super great, BUT.....to offer decent performance, from such a simple statement, imagine if you dug a little deeper and traveled a little further into the abyss. OR....even if you just wanted to add a few statements to help control Risk.....no problem. The point, you can use simple methods in a creative way, you can implement foundations of complex reasoning, into a simple structure. You dont always need 1000 moving parts. You can implement behavioral finance into your concept, with something as simple as analyzing Time - Based patterns. Remember.....most systems are End of Bar systems.... ( ie they execute using "NEXT BAR AT MARKET" or "NEXT BAR AT CLOSE LIMIT" or "NEXT BAR AT BID or ASK...ETC"). Also, the majority of larger firms, uses Daily bars and only trades U.S. sessions, so orders are executed in market open. OR, if they use a smaller bars size, like a 15min......if you had to choose "The most Important part of the 15 min bar?", what would it be? The first 30-60 seconds.....because the majority of systematic traders are using End of bar.. so their volumes are higher at begin, and Discretionary traders volume is higher afterwards. Whats really interesting, is when you break down, Which is historically more profitable, by analyzing and comparing future price direction to the volume ratio of each segment and trade type ( Discretionary and Systematic), within the bar.....but that discussion is for another post. For now, lets keep this in the framework of "investing".... If you know the market has an upward bias and uptrend is still strong.....and the 2 OClock FU combines forces with the Friday End of Week Exit or the Monday End of Day Exit ( because many Econ reports are released on Tuesday + Sluggishness of Blue Monday), to generate a massive downward price movement.....you could place your Long Entry, just before market close at an extreme/new price low....ie value. The graphs above are applied to ES eminisp500 Futures. However this concept can also be applied to Stocks, ETF's, Bonds, etc... Some markets will vary, and some may have specific patterns that no other market has, but the concept in general should be applicable. This is just a single, simple, and common example of when you break down Time, Price, Days, Weeks, Volatility, Momentum, and Volumes.....within the context of Human & Systematic Behavior, there are REAL supporting reasons why these patterns exists...and why they are likely to exists into the future...which also makes it easier to identify why&when they will not work in the future. If you really want to dive deep, you have to break it down into min by min, day by day, etc analysis......the data is extremely useful....but also very time consuming. I realize this is all common knowledge to experienced Quants/Traders, but to the avg investor/trader/developer, this is something that could be easily implemented into their strategy, even a buy and hold, to improve their outcome, which is the objective of this post. Next post, Ill dive deeper into the Quantitative analysis of this concept/analysis method/data. Any rate, I hope some of this is useful, and Good Luck on your never ending journey of discovery! Brian *Disclaimer: Historical performance whether live or simulated may not be indicative of future results. Trading Stocks, Options, FX, or Futures involves significant risks not suitable for all investors. Investors should only choose to invest funds he/she can afford to lose without impacting lifestyle. Price activity is not always predictable or repetitive, thus any strategy developed using historical data will be equally unpredictable. We do not guarantee our strategies or analysis methods will perform profitably and/or replicate results shown above, for any length of time. Before leasing/using our products, please consult your investment professionals, to discuss if our products are right for your risk tolerances & objectives. Price activity is not always repetitive or predictable, thus any strategy developed using historical data will be equally unpredictable.
0 Comments
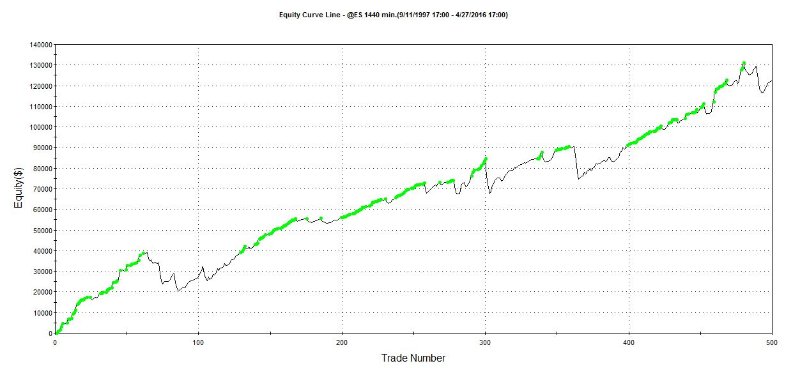
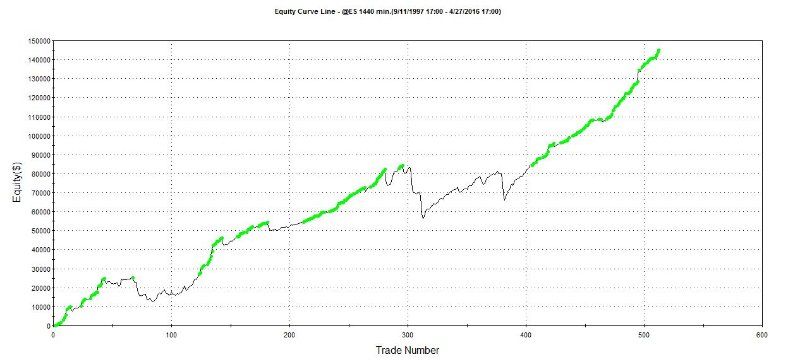
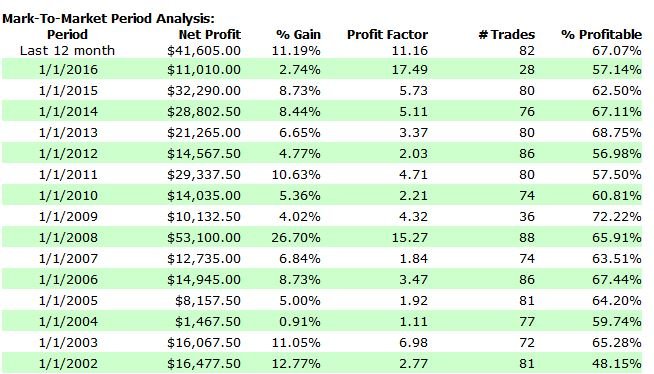
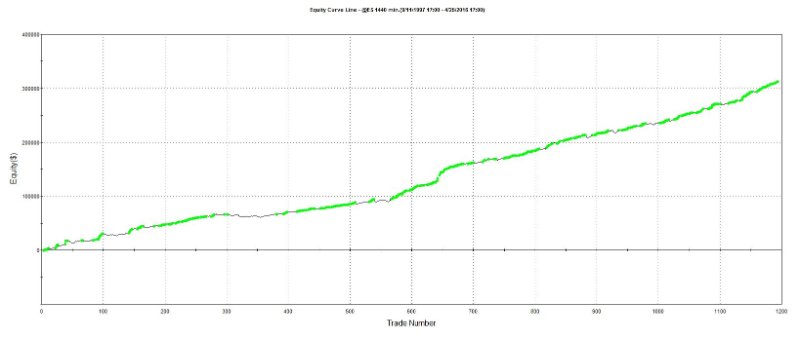
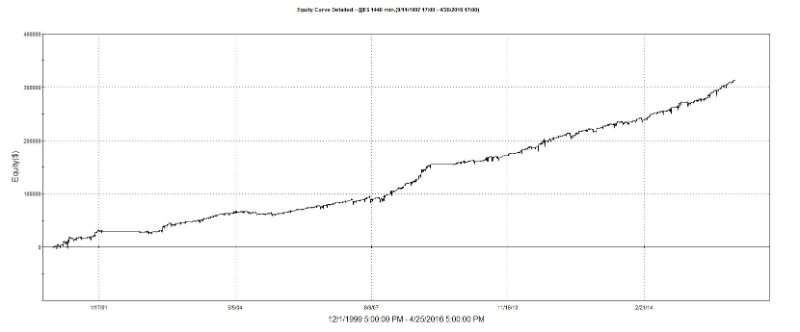
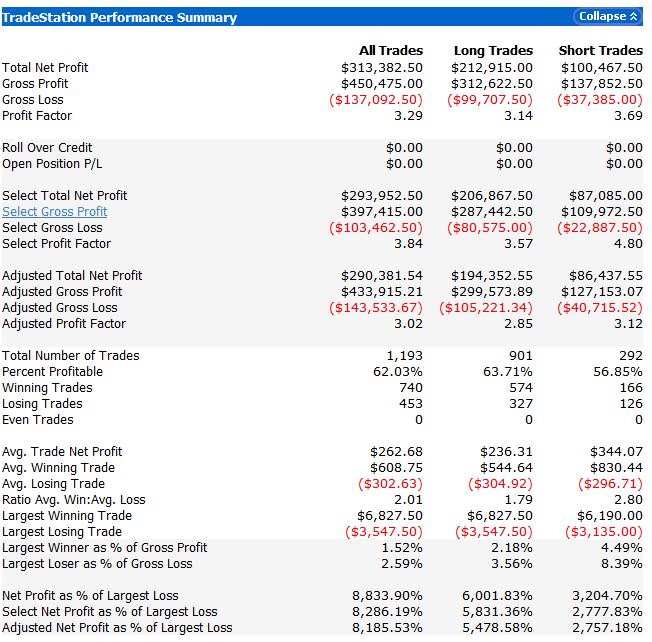
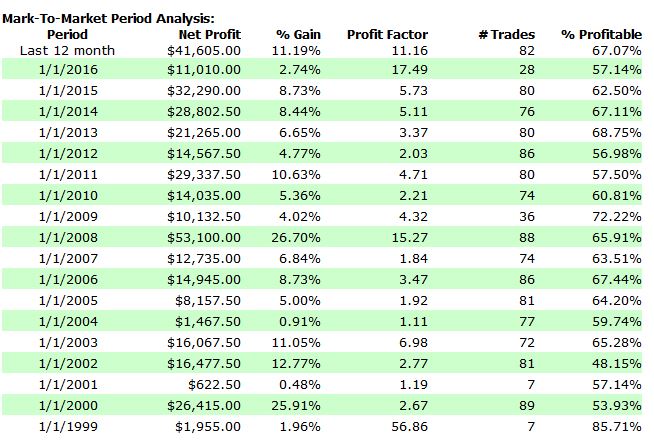
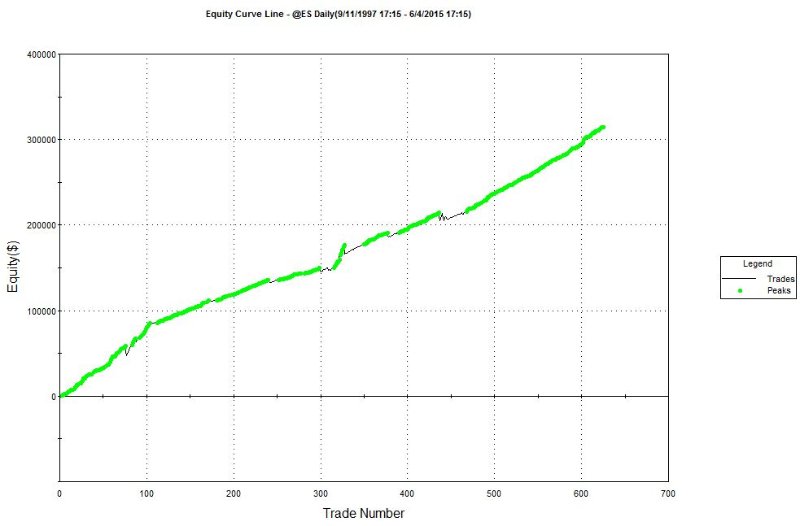
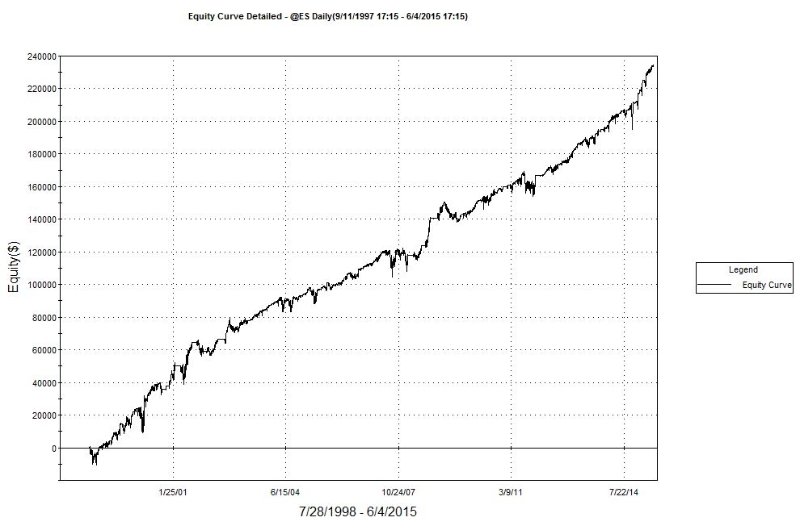
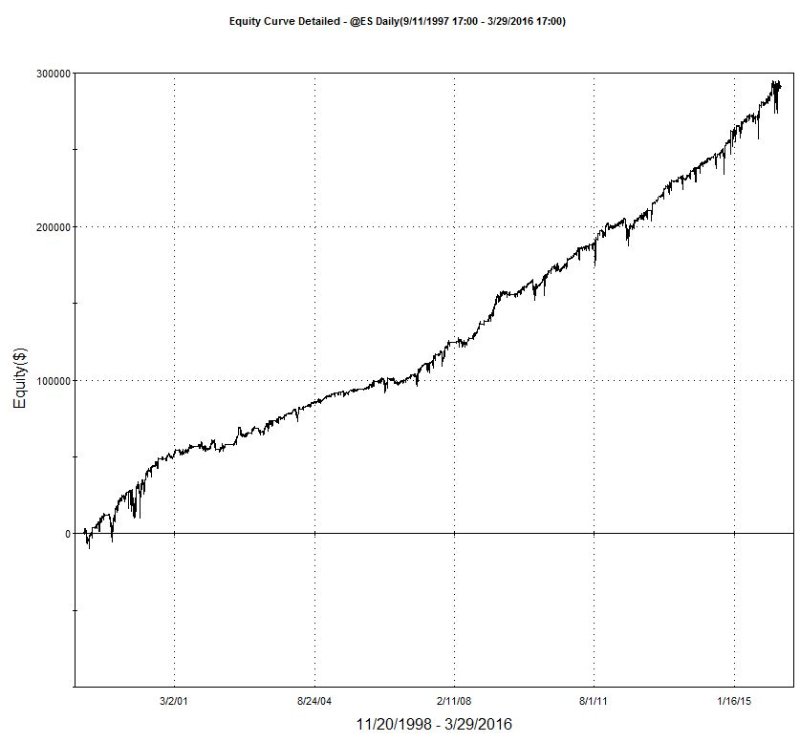
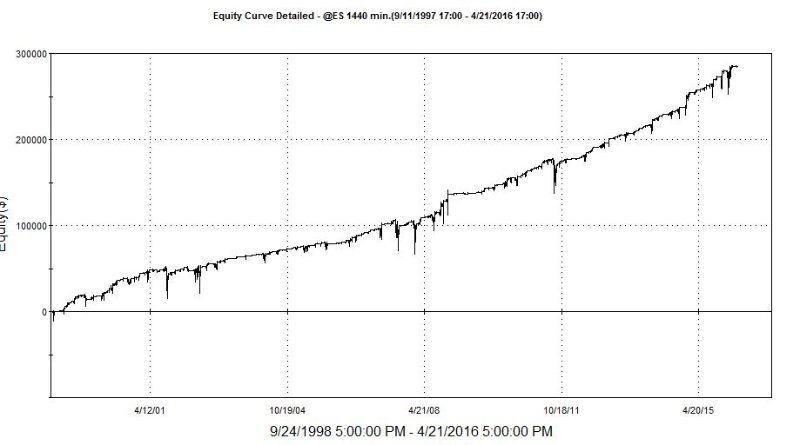
The ES_TRS_SR6t system that we will be launching shortly, is made up of a plethora of individual models/edges. I shared some results earlier from a generic GC(General Condition) Model/Edge, that was NOT optimized. Every non-dynamic input/value was pre-set to reflect time frame ( week, month, etc). GC Models = Edges designed to be consistent in all market conditions....slow n steady... CS Models (Condition Specific) = Edges designed to exploit specific biases, conditions, etc. CS models will always outperform a GC model while the market is in its designed condition/environment. GC models are implemented as a back-up.....safety net....to fill in any potential gaps, in case market decides to remain "Between Worlds" for some time. Here is the performance of that generic GC model. *Disclaimer: Historical performance whether live or simulated may not be indicative of future results. Trading Stocks, Options, FX, or Futures involves significant risks not suitable for all investors. Investors should only choose to invest funds he/she can afford to lose without impacting lifestyle. Price activity is not always predictable or repetitive, thus any strategy developed using historical data will be equally unpredictable. We do not guarantee our strategies or analysis methods will perform profitably and/or replicate results shown above, for any length of time. Before leasing/using our products, please consult your investment professionals, to discuss if our products are right for your risk tolerances & objectives. Price activity is not always repetitive or predictable, thus any strategy developed using historical data will be equally unpredictable. Here is the same Edge with only 2 inputs optimized, with with dynamic controls. Both the overall Risk profile and NetPft are both improved.....which is sometimes very hard to achieve. You can also see how tight the deviations are between Closed and Detailed graphs, which shows the robustness of entry to profit. Its rather easy to generate a great Closed Equity Curve, if you do not manage open position risk, but we actually focus more on mitigating open position risks, then we do closed risks, for obvious reasons. Another factor you have to consider, this is applied to ES Daily bar, which is a rather large bar size, when trading Futures systematically. From our research a 3 contracts Index Futures system, applied to a Daily bar, usually has Max $ risk Equity high to equity low, at any point in time, >$25K. However the GC model above maintains its risk $14K Max Risk. Obviously we cannot be certain this specific model will maintain this same risk profile for the next decade, or even the next day, but the difference between our systems and others.....if it doesnt and begins to fail, we have other thoroughbreds in the stable, ready to run. Now, we do not expect, nor will we ever rely on this model to perform exactly as it has in the past.....that is not logical, BUT what we can do, is use this performance to learn when/how to quickly identify & predict optimal solutions, and to set optimal ranges & logic for each model and the system as a whole. To constantly be searching/learning how & when to apply optimal solutions. Its imperative to not get caught up in individual model performance, as long as its consistent, concepts are based on fundamental & real-world justifications, and it meets performance mins, this is ok. We dont think historical performance will dictate exact future performance, however we feel its more like a Deviated range, but if you improve your starting point or initial classification, its easier to obtain an improved objective. We dont rely on Sharpe Ratio, or TSI, or RINA, or any individual performance metric or widely known metric formula.....instead we use a few different proprietary formulas to "Gauge" performance. We mainly search for time/consistency and low deviations between realized and unrealized performance. We search for models/edges, that have a quick (entry to profit) validation period....because we want keep % of time in the market as low as possible....while having a high trade frequency. We also do not get caught up in the "Its curve fitted" argument. If we include Model1A, and if it does not perform within its expected ranges into the future, it will not be considered for activation, thus it will not have a negative impact on performance. Both GC models above, are robust and could be traded as a stand-alone system, but we go light years beyond typical assumptions made by other developers/money managers, etc. As I said, GC models are merely as back-up plan....and rarely are they ever even activated.....in fact to date, not a single GC model has ever been activated, which speaks volumes to the quality of the CS models we include within each complete system. Below you'll see the yr to yr rolling. Notice how 2015, 2011, & 2008 outperformed other years. This is because the GC model above is designed to slightly outperform during Uptrends, however drastically outperform during Consolidations, Downtrends, and/or increased Volatility....as are many other of our models. *Disclaimer: Historical performance whether live or simulated may not be indicative of future results. Trading Stocks, Options, FX, or Futures involves significant risks not suitable for all investors. Investors should only choose to invest funds he/she can afford to lose without impacting lifestyle. Price activity is not always predictable or repetitive, thus any strategy developed using historical data will be equally unpredictable. We do not guarantee our strategies or analysis methods will perform profitably and/or replicate results shown above, for any length of time. Before leasing/using our products, please consult your investment professionals, to discuss if our products are right for your risk tolerances & objectives. Price activity is not always repetitive or predictable, thus any strategy developed using historical data will be equally unpredictable.
This model is Not compounded. It does not deploy any advanced money or risk management. It allows up to 3 contracts MAX per position, and 3 entries 1 contract per entry....however it rarely ever has 3 contracts open. This GC model is included within our ES_TRS_SR6t system, and we recommend $40K initial investment. This system is designed for the investor, NOT the "trader". Its applied to a Daily bar, and CS models always have much higher trade frequency than GC models, so actual complete system trade frequency is approx 6-12 trades per month, but it can go weeks without trading at all, until optimal conditions are identified or predicted. A variation of this system will be offered on our vast network of trading platforms & brokers. Please contact for additional details. Thank You Brian Miller The majority of traders, developers, strategist, etc know and realize that no edge/model will last forever. No matter how robust your signal/edge/alpha/etc, eventually the markets will gradually fade away, cycle in and out of generating positive outcome, or suddenly never look back. The best traders, developers, fund managers realize in order to achieve optimal time/return, you must think in pliable terms......even though Ive always walked my own path, conformity in this instance is required. Allowing your "System" to adapt and conform its "optimal solution" to an ever evolving "problem" is the only way to truly find consistent and reliable results. Now, there are several methods and/or method combos you can apply to implement adaptability into your conceptual design....such as but not limited too:
We implement multiple variations of the methods mentioned above in our systems, so that we never correlate Returns or Risks to a single edge, model, strategy, market condition, etc. Because we realize, we are playing a game thats constantly changing the type of ball used....the rules are the same....the field is the same.....but everything else is fair game to evolve with time. We also realize and accept....we do not know the future...and we can never allow ourselves to trust any individual model/strategy/edge, no matter how "Pure"/"Robust" it may be. ( ie we dont like putting all our eggs in one basket). The past few years of research, we found that the major market conditions can be broken up into the following subgroups/profiles/regimes of ( Uptrend, Downtrend, Consolidation, Reverting) ( ie reverting is consolidation, but of a smaller cyclic size/freq) Applied to each "Main" Group of Uptrend, Downtrend, Consolidation ie(Strong & Weak of both upward bias & downward bias )
(BREAKING IT DOWN) If you've read my previous posts, you'll hear me say.....you have to break down and categorize every piece of data, and place it into: Its critical you step outside the traditional development box, and be creative in what types of data you analyze, but also how you separate and classify&compare it.
UP Price Movement: 1. close-open 2. High-open 3. high-close[1] 4. high-high[1] 5. low - low[1] 6. price - price[x] UP Volume: 1. upticks 2. upticks - downticks 3. up volume 4. up volume - down volume 5. upticks - upticks[1] 6. upticks + upticks[1] 7. upvolume - upticks 8. UpVolume + Upticks 9. upVolume - Downticks 10. upticks - down volume etc etc etc COMBINATION Example of dynamic method LenX = # of bars in Last Cycle High to Cycle Low or Cycle Low to Cycle OR LenX = # of bars of Avg bars in Volatility or Momentum Cycle OR LenX = # of bars in XTime ( Hour, Day, Week, Contract Exp) Initial calc = PropFunctionX((High-open) * (upVolume data1 - downticks data2),LenX) If Initial calc Initial calc[y] then Initial calc = PropFunctionX((open-low) * (DownVolume data1 - upticks data2),LenX) OR Initial calc = PropFunctionX((High-open) * (upVolume data1 - downticks data2),LenX) - PropFunctionY((open-low) * (DownVolume data1 - upticks data2),LenX) or Initial calc = PropFunctionX((close-open) * (upVolume data1 - downvolume data1 data2),LenX) etc etc You'll have to play around with the calculation to see what works for what your trying to capture/achieve/find. (to Differentiate Volume from Tick Fluctuations, you have to use multiple data streams or PSP) Depending on the current value of InitialCalc, you can alter the calculation and/or values to reflect how the strength of opposing force/pressure has taken control. EX: InitialCalc = FunctionX (close-open, X) - FunctionX(close-open,X)[x] if initialcalc initialcalc[x] then initialcalc = Functionx(close-open,X) - Functionx(open-low,X)[x] Your implenting price movement into your calculation, that actually reflects the direction price moved, from your historical point. Implementing this will improve predictive power, especially when you begin running probability mapping. Simple predictive methods, to find next bar volatility and High and Low ranges/probable price points, you start by:
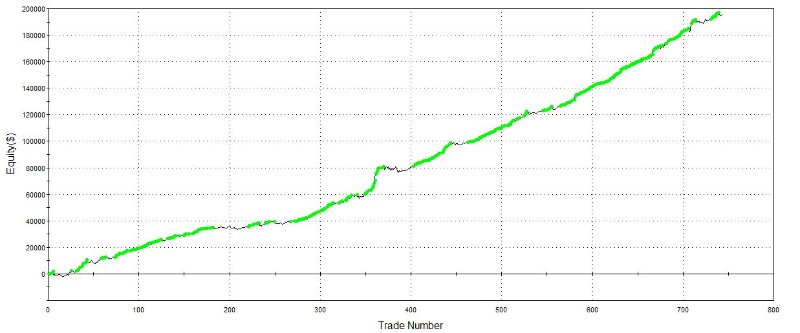
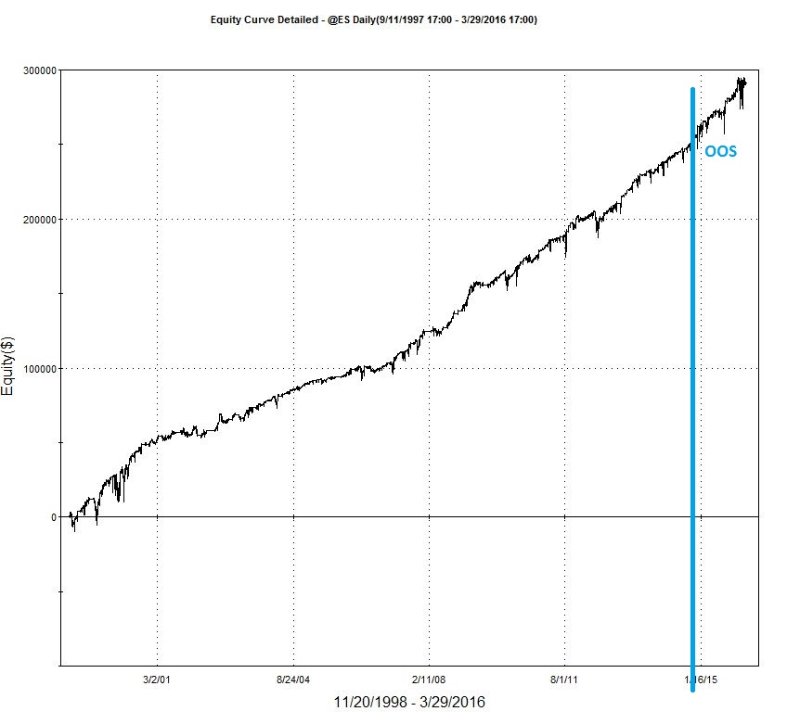
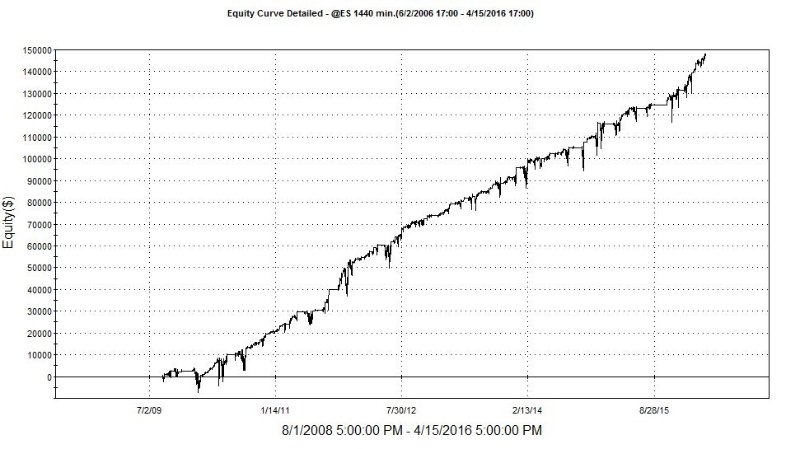
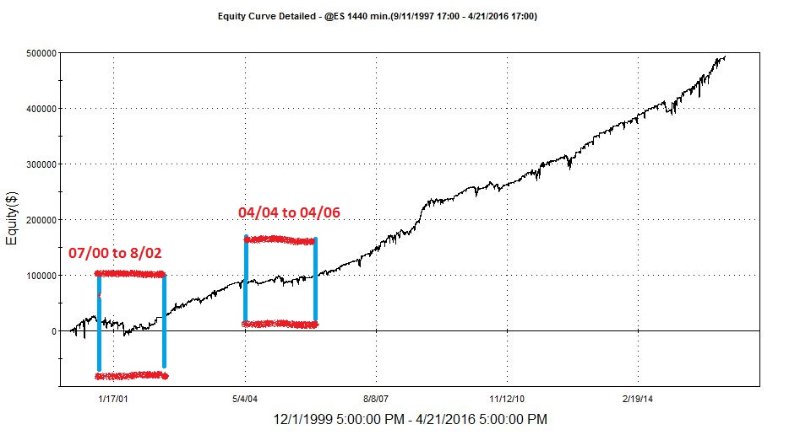
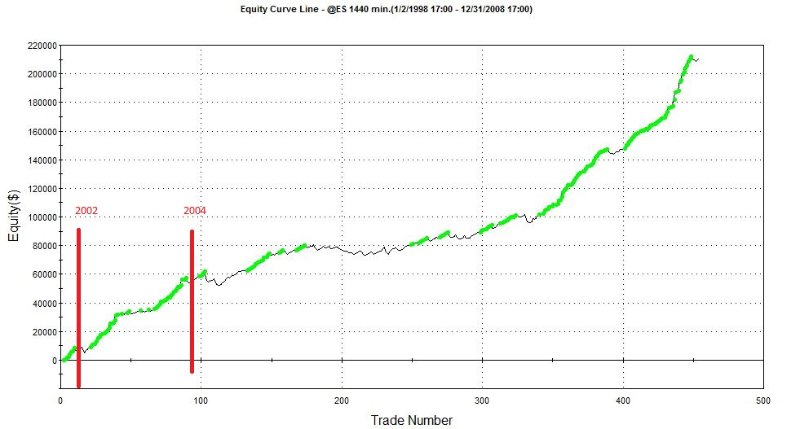
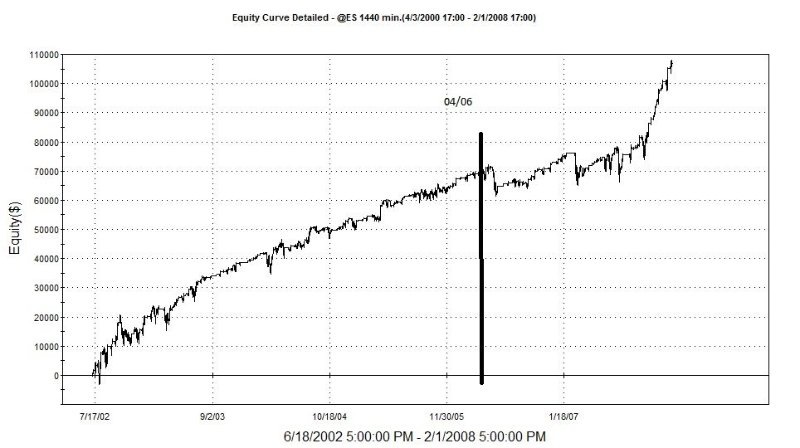
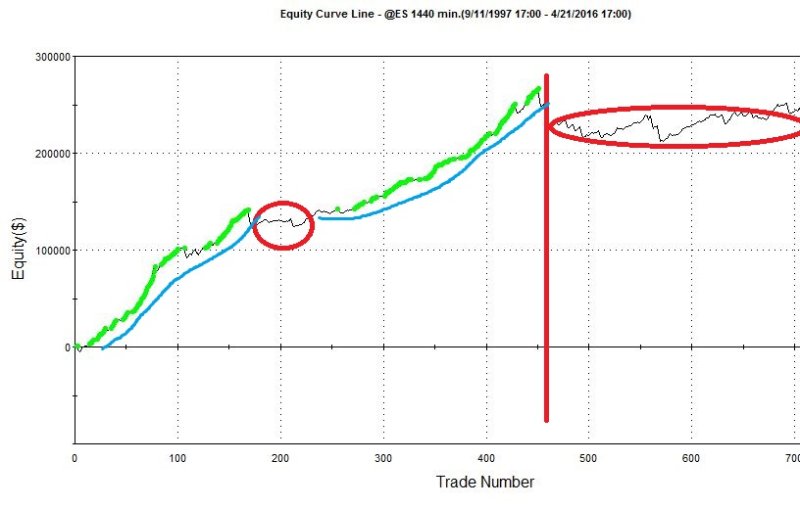
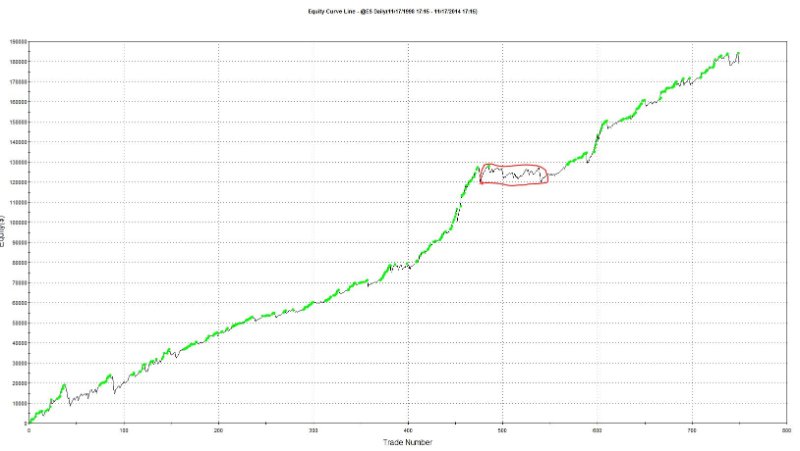
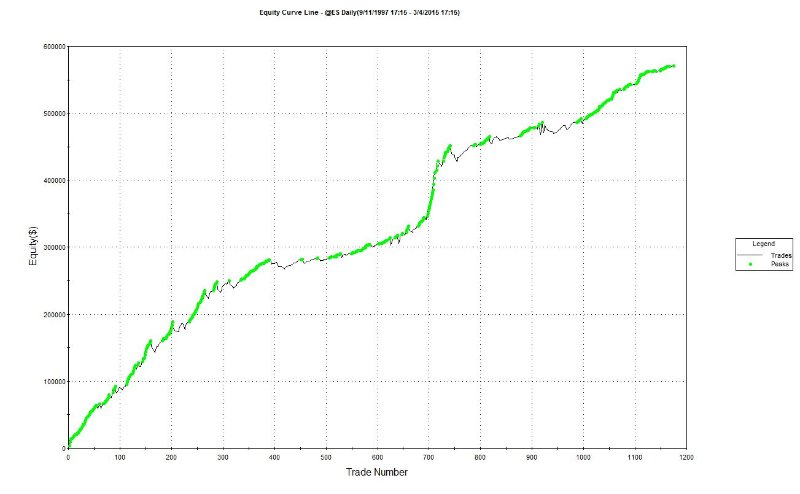
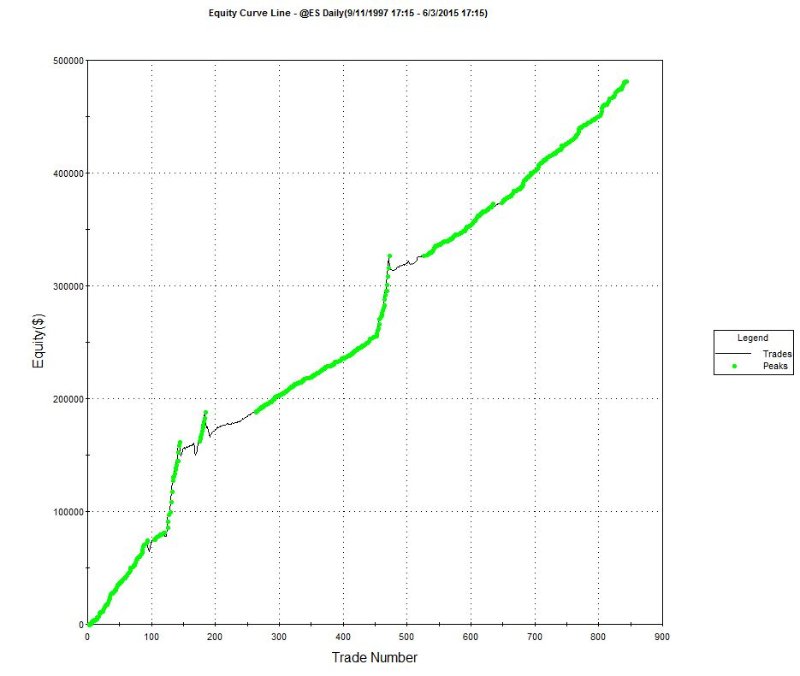
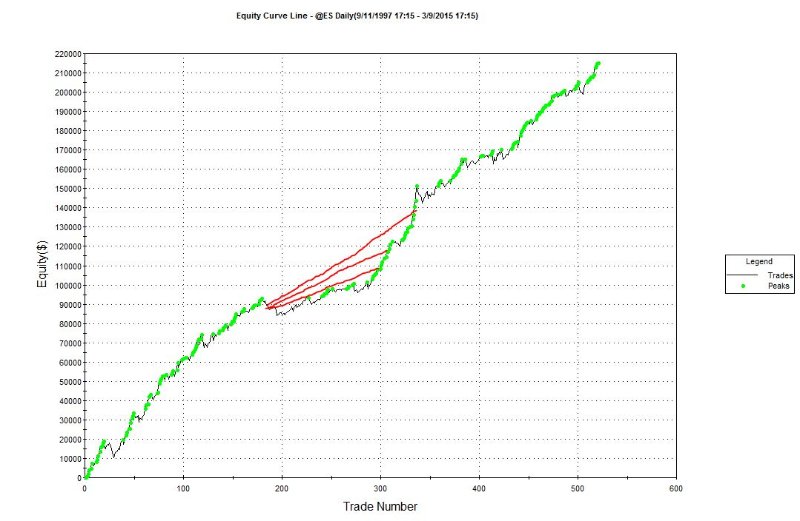
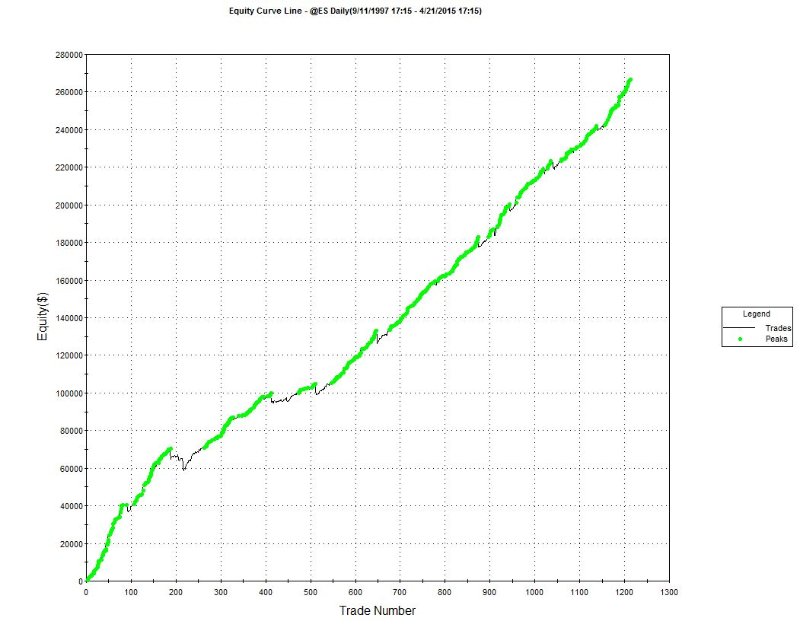
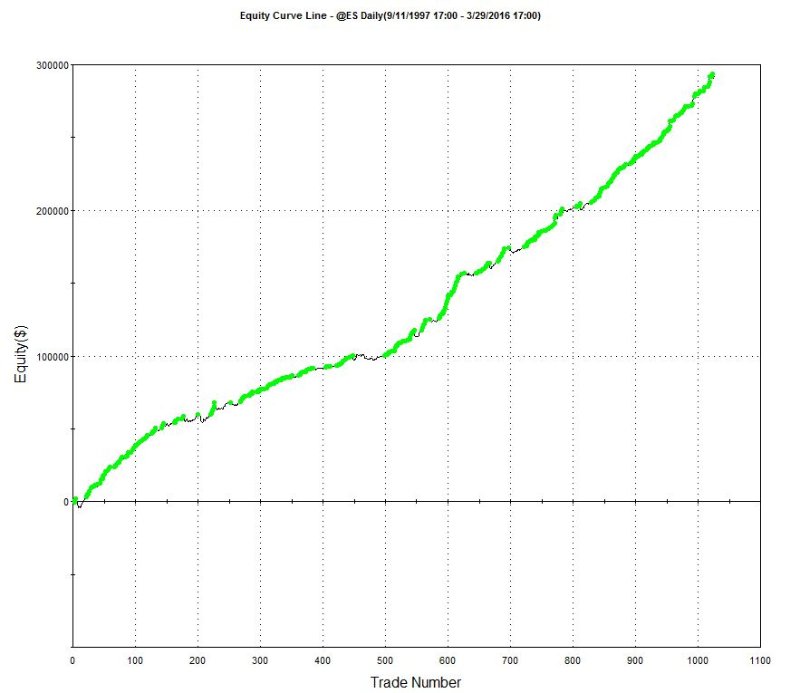
Then using these bits of info, you piece together a calculation that you apply to last bars close[0], if you want 1 bar projection. Or if your trading IOG, these values update intrabar. Take the avg's values, along with accel/decel to alter the projected values. You can average the calculation with historical avgs, or not...its up to you. Its also crucial to analyze multiple frequencies, and not gauge or make conclusions based off of a single time-series. Think of the market as a 3-d entity. You have to look at (Price, Volume, & Fundamentals) + Sentiment + Multiple frequencies We usually look at: 15min 45min 180min 360min Daily Weekly We develop systems for 15min 45min 135min 180min Daily Our research shows ES has a frequency strength of 42-48 mins, so we use 45min for ease... The graph above is of a GC model....(General Condition). This model was created in 11-2014, and its OOS performance has been >= historical ranges The graph above is of a Behavior specific model applied to 06-06 to 04-16. However the model begins trading in 08-2009. You can see how Risk metrics will usually be improved with a Behavior specific model, then with a GC model. Now, no matter the quality of your individual models/edges, and no matter how intelligent your control modules are....your going to experience losing trades, days, weeks, etc. The goal is to reduce those as much as possible, while also reducing the risk of strategic/systematic failure. When you focus on Risk mitigation and consistency....everything else will follow. Basically your "Extracting" the best parts of each model.....your only activating a model when its offering very robust performance. Here is a perfect example of a "Promising" edge blowing up in your face. Now the first 60% of this performance is pretty good, except for the time period of the first Red Circle, which could be easily solved by activating/trading a different model. However performance after the RedLine, is just horrible. My point, is you never know when a promising edge will fall out of favor, thus its not logical to rely on any perspective of singularity, no matter how "robust" it may have been historically or OOS. Here are some general example of GC(General Condition) models that we have as an option ton include within our Multi-Model systems. We try to keep all the concepts and performance as diversified as possible, while staying within the confines of each markets characteristics. Graph above is of a single contract version, but I highlighted a period of time, in which this GC model would not have met/exceeded our performance requirements. The Graph above if a Long Only model, and as you can see it goes through a 1 - 1.5 year period where the rate of growth was reduced. When you deploy multiple robust models, you can be as aggressive as you like, and seek to only activate models that offer Higher Return, rather than lower risk......its an option. The graph above, is a perfect example of performance we prefer. We want consistent growth, with no major disruptions in ROG, with good trade frequency, and Low Deviations between Closed and Unrealized performance. The graph above, is a Long Only model. When you develop a multi model systems. Model break-down/analysis is split into 3 categories:
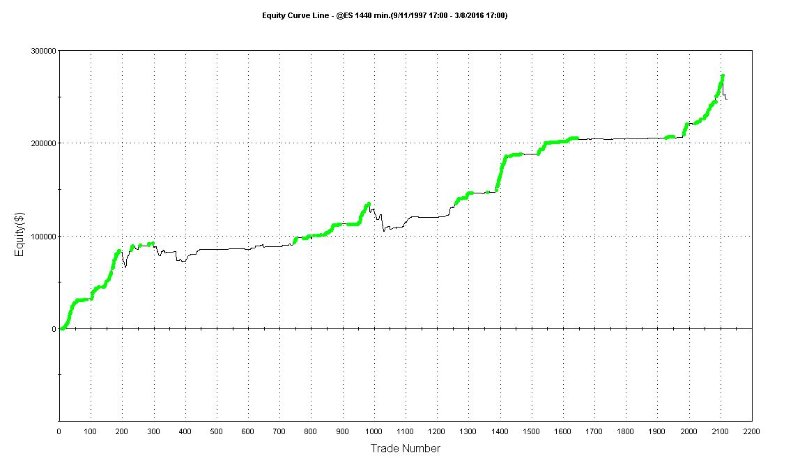
Finally and most important......stay in your lane. Meaning, never force a concept to work. Always work within the guidelines on the markets characteristics. EX: ES = Upward Bias / Drift + Strong Reverting Characteristics ( on multiple frequencies) Keeping the underlying strategic concept as simple as possible is vital, I would say creativity should be focused on more than complexity. Probably the simplest concept is looking for Divergence among Price and Volume, and playing off of the markets characteristics. Then allow for a few entries per position, and close on any Daily bar that closes profitable, and allow the position to work up to 5-6 days past the last entry. Since the ES has a very strong Daily and Weekly reverting characteristic/pattern, if you allow up to 5 entries, and allow 5 days to work, past the 5th entry.....if you make it that far before it closes profitably.....this simple concept performs quite well....for KISS. Just imagine if you really dive into the creative side of what the foundation has to offer. The tricky part is keeping Trade frequency high, + Good Profit Factor, + Low Deviations between Realized and Unrealized, so I always begin a search process for signals that has a quick validation time frame.....meaning the quicker it becomes profitable...the better. This way, once this initial/optimal validation period has passed, I can begin to initialize more adaptive/dynamic processes, such as syncing my Exit logic to time decay and momentum+volatility analysis. Because if it has not become profitable within YTime, I know the probability of it closing profitably continue to decline rapidly with each additional bar/hour/day/etc. Another option, is to find signals that may occur in sequence, and in certain time periods/frames. If signalABC occurs but it has a high occurrence that the third and fourth time it signals within XDays, the 3rd and 4th signal have a very quick validation period. So instead of allowing an entry to execute on the first or second signal.....you can only allow it to execute on the 3rd and 4th time its true. Sometimes its best to first allow simple logic to work.....then if and when your entry should require more attention, then allow more "intelligent / involved" processes to manage the position. The larger the frequency traded, the more difficult it is to deploy efficient time decay dynamic processes, but if you should combine a Daily + XMin frequencies into a single system, then use a 15min-180min bar for the micro analysis, this usually works best.....at least for our methods/concepts. Here is a generic graph, of the concept above, with NO....NO dynamic processes. Its just the basic entry statement/logic, with super simple/stagnant exit logic. Now there are some open position dips, but again, the strategy/model could NOT be more simple....trust me. My point, this is a brick...not the house. However this is trading ES Futures Daily bar (1440min), so the larger the frequency, the larger the open position risks....thats natural. Again, the cool and nerdy parts, is when you take this brick, and exploit it via smaller frequency (15min - 180min). Anything > 180min doest really create a big benefit, because the smaller freq must be beneath a certain size so you can deploy efficient time decay methods. TIME DECAY: Applying dynamic analysis/methods/processes, that initiate after some event, that begin to adapt your Profit and Loss Exit logic, or multiple entry logic, based on historical research + real-time volatility and momentum analysis. Allowing for constant adjustments/reductions/tightening of your Exit values, which improve the probabilities of allowing the position to exit as a winner winner chicken dinner....and/or reducing the Loss value. So you see.....quality performance can be achieved with simple constructs, it just requires a little insight, and not sticking to "Traditionalist" idealism of how or what a strategy and its processes should be......
I realize I given a few nuggets in this post, but I hope I have answered some questions and explained who we are as a firm....and the steps we take to design quality algorithms. Everyone has their own way of doing things, so there is no right or wrong way, so whatever works best for you...is best. I hope this post speaks a little about our conceptual philosophy and we feel its so important to never correlate Return or Risk to a single model, edge, bias, condition, etc. Optimized Trading's programs will be offered through our vast network of trading platforms & brokers. Please contact for additional details. We are only offering our systems as a monthly lease option via 3rd party providers. We do not and will not ever sell our systems outright, nor will we give clients access to our proprietary code/works. Eventually, once our website is operational(hopefully soon), we may offer an automated signal service, partnering with the major platforms and brokers, for our Stock and ETF systems. Good Luck on your never ending journey of discovery Brian Miller *Disclaimer: Historical performance whether live or simulated may not be indicative of future results. Trading Stocks, Options, FX, or Futures involves significant risks not suitable for all investors. Investors should only choose to invest funds he/she can afford to lose without impacting lifestyle. Price activity is not always predictable or repetitive, thus any strategy developed using historical data will be equally unpredictable. We do not guarantee our strategies or analysis methods will perform profitably and/or replicate results shown above, for any length of time. Before leasing/using our products, please consult your investment professionals, to discuss if our products are right for your risk tolerances & objectives. Price activity is not always repetitive or predictable, thus any strategy developed using historical data will be equally unpredictable. |
Archives
March 2018
Categories |
Risk Disclosure:
Futures and forex trading contains substantial risk and is not for every investor. An investor could potentially lose all or more than the initial investment. Risk capital is money that can be lost without jeopardizing ones’ financial security or life style. Only risk capital should be used for trading and only those with sufficient risk capital should consider trading. Past performance is not necessarily indicative of future results.
Hypothetical Performance Disclosure:
Hypothetical performance results have many inherent limitations, some of which are described below. no representation is being made that any account will or is likely to achieve profits or losses similar to those shown; in fact, there are frequently sharp differences between hypothetical performance results and the actual results subsequently achieved by any particular trading program. One of the limitations of hypothetical performance results is that they are generally prepared with the benefit of hindsight. In addition, hypothetical trading does not involve financial risk, and no hypothetical trading record can completely account for the impact of financial risk of actual trading. for example, the ability to withstand losses or to adhere to a particular trading program in spite of trading losses are material points which can also adversely affect actual trading results. There are numerous other factors related to the markets in general or to the implementation of any specific trading program which cannot be fully accounted for in the preparation of hypothetical performance results and all which can adversely affect trading results.
Disclaimer: The principals of Optimized Trading understand regardless of the rigorous testing involving the development of systematic trading systems they are not infallible. Markets are dynamic and it may be necessary under special market conditions to intervene on the behalf of clients to protect their interests.
 RSS Feed