|
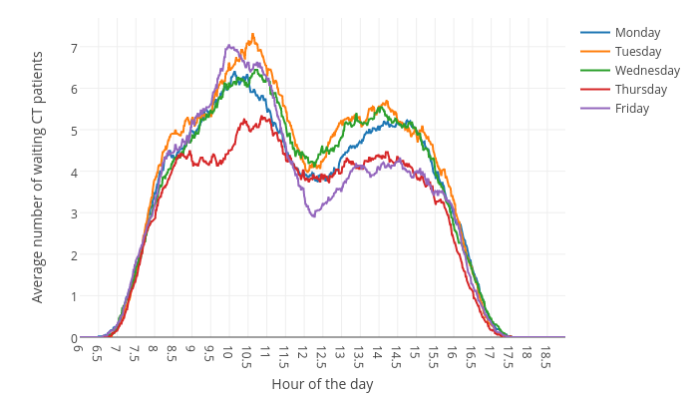
"Creatures", in this case = human or algorithm executing entries and exits. I was searching for a generic photo, that had the different days of the weeks, but in different languages, when I came across this graph, which shows historical Days of Week averages of patients waiting for CT scans....which you may think has absolutely NOTHING to do with Trading or Investing strategies...right?! WRONG! Look at the hours of the day.....humm. Im not going to dive deeply into human psychology, behavior, but if you spend some time studying Behavioral Finance, you'll find many real-world justifications for why certain days, have certain patterns, even extracting the algorithms from the equation, the human effect upon the market, therefore the human behavior upon the market is quite easily quantifiable, and to the avg investor/trader/developer, looking at days of week patterns, could be something useful to help improve your outcome, without diving deep into BF. Some simple studies/indicators can be developed, to search for each days( M, Tu, W, Th, F, Sa, Su) avg's such as:
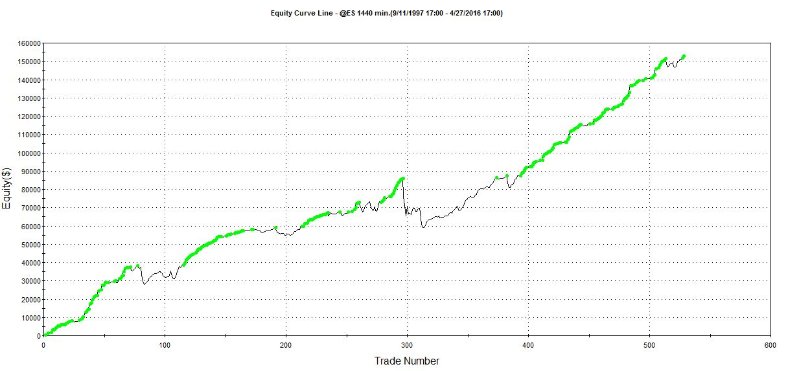
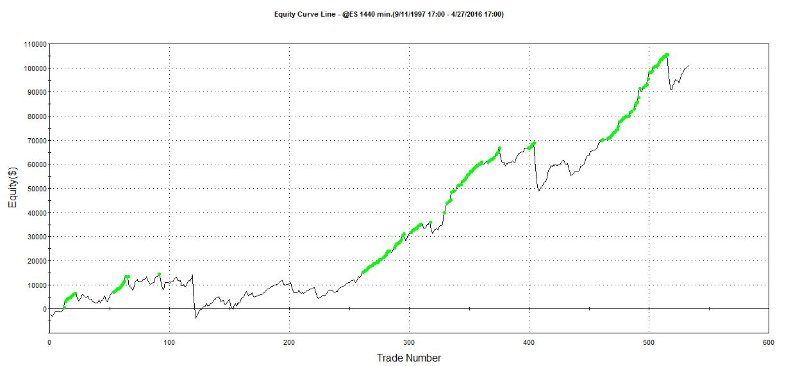
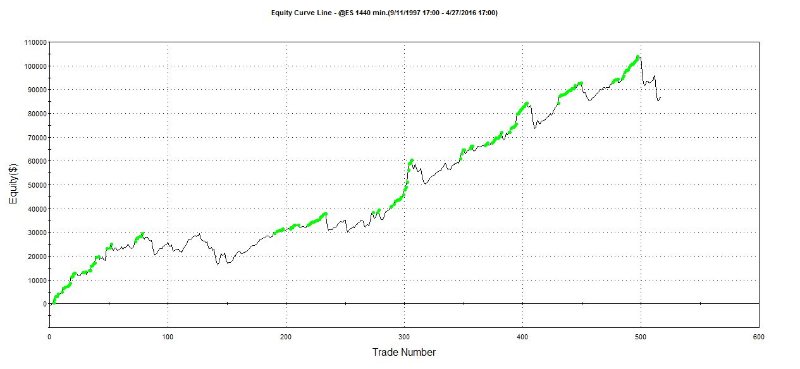
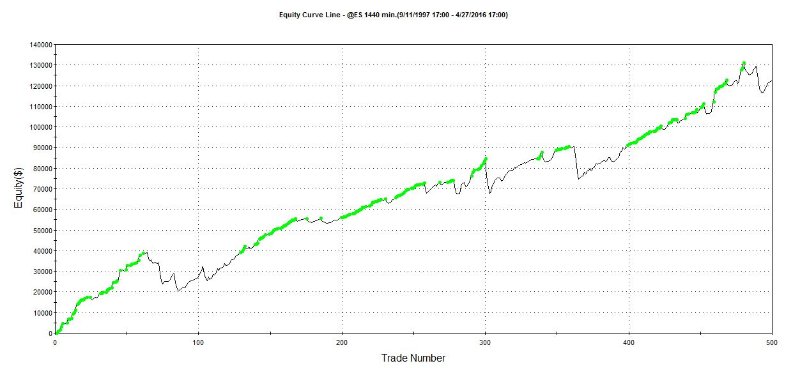
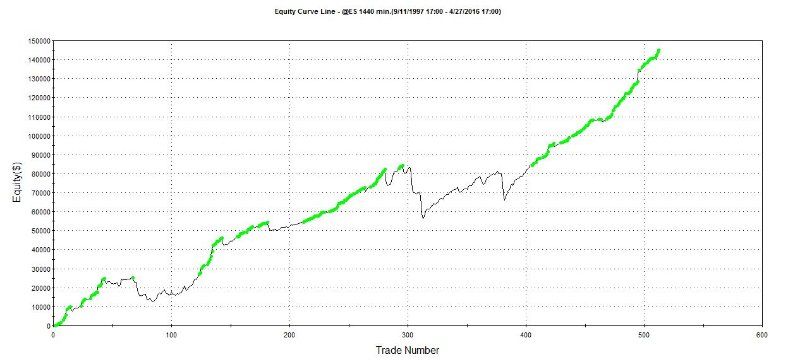
EX: The majority of humans, despise getting up early on Monday to go to work, directly after they came home from a long weekend at camp...or the beach...or the ball game. So Monday's, starts slow for you, until you get back in the "groove" of your work week....which could be after the 2nd or 3rd cup of Joe, which would lower the number of Discretionary traders. However, many traders, firms, or systems close out positions on Friday, to control risks, so they may be Jumping back in on MOnday....Now, the humans in the pits on wallstreet or CME are no different.... When you add the algorithms into the equation, they simply multiply the effect, because thats what they do.....they increase volatility, liquidity, etc. So any human behavior pattern, that has small effect on the market, is now multiplied. Also, algorithms are developed by humans, so in many instances, they reflect the desires of a human..... EX: Human Trader Brad.....is a swing trader, but he closes out all positions on Friday, so he doesnt hold any Risk over the weekend. Brad, also developed a system, that trades a different strategy, but deploys the same EOW exit logic for risk mitigation. So you have End of Day Exits ( Known as the 2 Oclock FU), and End of Week Exits. Then you have algorithms that multiply and increase price direction strength / momentum / vola / etc. So You can get massive price movements at certain times...and on certain days. I could go on for years, detailing every reason why, certain times of every day, or certain times of certain days or weeks, or certain minutes of certain hours, have these patterns. Such as Economic & News reports, Earnings releases, Session open/closes, lunch time siesta, " effects of Next bar executions", start of week, end of week, start of day, end of day, start of bar, end of bar, etc... Basically, you can create a simple strategy, that does not require Intense Quantitative analysis.....just some simple run-of-the-mill technical analysis will work fine. Here are Daily EC's from a Long Only strategy, that has Generic Four lines of code, and allows 3 entries ( 1 contract per entry). if DayOfWeek( Date ) = DayOfWk and close open then Buy next bar at close limit; if DayOfWeek( Date ) = DayOfWk and close > open then sell next bar at close limit; If mp = 1 and close > open and openpositionprofit > 0 then sell next bar at close limit; if mp = 1 and close > open and closeW > closeW[1] then sell next bar at close limit; *Disclaimer: Historical performance whether live or simulated may not be indicative of future results. Trading Stocks, Options, FX, or Futures involves significant risks not suitable for all investors. Investors should only choose to invest funds he/she can afford to lose without impacting lifestyle. Price activity is not always predictable or repetitive, thus any strategy developed using historical data will be equally unpredictable. We do not guarantee our strategies or analysis methods will perform profitably and/or replicate results shown above, for any length of time. Before leasing/using our products, please consult your investment professionals, to discuss if our products are right for your risk tolerances & objectives. Price activity is not always repetitive or predictable, thus any strategy developed using historical data will be equally unpredictable. MONDAY TUESDAY WEDNESDAY THURSDAY FRIDAY So as you can see, if you using a "Value" long only investing strategy, you could improve performance, simply by being a little more selective on which day(s) you allow entries to execute @Value.
Now, I realize these Equity Curves are not super great, BUT.....to offer decent performance, from such a simple statement, imagine if you dug a little deeper and traveled a little further into the abyss. OR....even if you just wanted to add a few statements to help control Risk.....no problem. The point, you can use simple methods in a creative way, you can implement foundations of complex reasoning, into a simple structure. You dont always need 1000 moving parts. You can implement behavioral finance into your concept, with something as simple as analyzing Time - Based patterns. Remember.....most systems are End of Bar systems.... ( ie they execute using "NEXT BAR AT MARKET" or "NEXT BAR AT CLOSE LIMIT" or "NEXT BAR AT BID or ASK...ETC"). Also, the majority of larger firms, uses Daily bars and only trades U.S. sessions, so orders are executed in market open. OR, if they use a smaller bars size, like a 15min......if you had to choose "The most Important part of the 15 min bar?", what would it be? The first 30-60 seconds.....because the majority of systematic traders are using End of bar.. so their volumes are higher at begin, and Discretionary traders volume is higher afterwards. Whats really interesting, is when you break down, Which is historically more profitable, by analyzing and comparing future price direction to the volume ratio of each segment and trade type ( Discretionary and Systematic), within the bar.....but that discussion is for another post. For now, lets keep this in the framework of "investing".... If you know the market has an upward bias and uptrend is still strong.....and the 2 OClock FU combines forces with the Friday End of Week Exit or the Monday End of Day Exit ( because many Econ reports are released on Tuesday + Sluggishness of Blue Monday), to generate a massive downward price movement.....you could place your Long Entry, just before market close at an extreme/new price low....ie value. The graphs above are applied to ES eminisp500 Futures. However this concept can also be applied to Stocks, ETF's, Bonds, etc... Some markets will vary, and some may have specific patterns that no other market has, but the concept in general should be applicable. This is just a single, simple, and common example of when you break down Time, Price, Days, Weeks, Volatility, Momentum, and Volumes.....within the context of Human & Systematic Behavior, there are REAL supporting reasons why these patterns exists...and why they are likely to exists into the future...which also makes it easier to identify why&when they will not work in the future. If you really want to dive deep, you have to break it down into min by min, day by day, etc analysis......the data is extremely useful....but also very time consuming. I realize this is all common knowledge to experienced Quants/Traders, but to the avg investor/trader/developer, this is something that could be easily implemented into their strategy, even a buy and hold, to improve their outcome, which is the objective of this post. Next post, Ill dive deeper into the Quantitative analysis of this concept/analysis method/data. Any rate, I hope some of this is useful, and Good Luck on your never ending journey of discovery! Brian *Disclaimer: Historical performance whether live or simulated may not be indicative of future results. Trading Stocks, Options, FX, or Futures involves significant risks not suitable for all investors. Investors should only choose to invest funds he/she can afford to lose without impacting lifestyle. Price activity is not always predictable or repetitive, thus any strategy developed using historical data will be equally unpredictable. We do not guarantee our strategies or analysis methods will perform profitably and/or replicate results shown above, for any length of time. Before leasing/using our products, please consult your investment professionals, to discuss if our products are right for your risk tolerances & objectives. Price activity is not always repetitive or predictable, thus any strategy developed using historical data will be equally unpredictable.
0 Comments
Your comment will be posted after it is approved.
Leave a Reply. |
Archives
March 2018
Categories |
Risk Disclosure:
Futures and forex trading contains substantial risk and is not for every investor. An investor could potentially lose all or more than the initial investment. Risk capital is money that can be lost without jeopardizing ones’ financial security or life style. Only risk capital should be used for trading and only those with sufficient risk capital should consider trading. Past performance is not necessarily indicative of future results.
Hypothetical Performance Disclosure:
Hypothetical performance results have many inherent limitations, some of which are described below. no representation is being made that any account will or is likely to achieve profits or losses similar to those shown; in fact, there are frequently sharp differences between hypothetical performance results and the actual results subsequently achieved by any particular trading program. One of the limitations of hypothetical performance results is that they are generally prepared with the benefit of hindsight. In addition, hypothetical trading does not involve financial risk, and no hypothetical trading record can completely account for the impact of financial risk of actual trading. for example, the ability to withstand losses or to adhere to a particular trading program in spite of trading losses are material points which can also adversely affect actual trading results. There are numerous other factors related to the markets in general or to the implementation of any specific trading program which cannot be fully accounted for in the preparation of hypothetical performance results and all which can adversely affect trading results.
Disclaimer: The principals of Optimized Trading understand regardless of the rigorous testing involving the development of systematic trading systems they are not infallible. Markets are dynamic and it may be necessary under special market conditions to intervene on the behalf of clients to protect their interests.
 RSS Feed