 The majority of traders, developers, strategist, etc know and realize that no edge/model will last forever. No matter how robust your signal/edge/alpha/etc, eventually the markets will gradually fade away, cycle in and out of generating positive outcome, or suddenly never look back. The best traders, developers, fund managers realize in order to achieve optimal time/return, you must think in pliable terms......even though Ive always walked my own path, conformity in this instance is required. Allowing your "System" to adapt and conform its "optimal solution" to an ever evolving "problem" is the only way to truly find consistent and reliable results. Now, there are several methods and/or method combos you can apply to implement adaptability into your conceptual design....such as but not limited too:
We implement multiple variations of the methods mentioned above in our systems, so that we never correlate Returns or Risks to a single edge, model, strategy, market condition, etc. Because we realize, we are playing a game thats constantly changing the type of ball used....the rules are the same....the field is the same.....but everything else is fair game to evolve with time. We also realize and accept....we do not know the future...and we can never allow ourselves to trust any individual model/strategy/edge, no matter how "Pure"/"Robust" it may be. ( ie we dont like putting all our eggs in one basket). The past few years of research, we found that the major market conditions can be broken up into the following subgroups/profiles/regimes of ( Uptrend, Downtrend, Consolidation, Reverting) ( ie reverting is consolidation, but of a smaller cyclic size/freq) Applied to each "Main" Group of Uptrend, Downtrend, Consolidation ie(Strong & Weak of both upward bias & downward bias )
(BREAKING IT DOWN) If you've read my previous posts, you'll hear me say.....you have to break down and categorize every piece of data, and place it into: Its critical you step outside the traditional development box, and be creative in what types of data you analyze, but also how you separate and classify&compare it.
UP Price Movement: 1. close-open 2. High-open 3. high-close[1] 4. high-high[1] 5. low - low[1] 6. price - price[x] UP Volume: 1. upticks 2. upticks - downticks 3. up volume 4. up volume - down volume 5. upticks - upticks[1] 6. upticks + upticks[1] 7. upvolume - upticks 8. UpVolume + Upticks 9. upVolume - Downticks 10. upticks - down volume etc etc etc COMBINATION Example of dynamic method LenX = # of bars in Last Cycle High to Cycle Low or Cycle Low to Cycle OR LenX = # of bars of Avg bars in Volatility or Momentum Cycle OR LenX = # of bars in XTime ( Hour, Day, Week, Contract Exp) Initial calc = PropFunctionX((High-open) * (upVolume data1 - downticks data2),LenX) If Initial calc Initial calc[y] then Initial calc = PropFunctionX((open-low) * (DownVolume data1 - upticks data2),LenX) OR Initial calc = PropFunctionX((High-open) * (upVolume data1 - downticks data2),LenX) - PropFunctionY((open-low) * (DownVolume data1 - upticks data2),LenX) or Initial calc = PropFunctionX((close-open) * (upVolume data1 - downvolume data1 data2),LenX) etc etc You'll have to play around with the calculation to see what works for what your trying to capture/achieve/find. (to Differentiate Volume from Tick Fluctuations, you have to use multiple data streams or PSP) Depending on the current value of InitialCalc, you can alter the calculation and/or values to reflect how the strength of opposing force/pressure has taken control. EX: InitialCalc = FunctionX (close-open, X) - FunctionX(close-open,X)[x] if initialcalc initialcalc[x] then initialcalc = Functionx(close-open,X) - Functionx(open-low,X)[x] Your implenting price movement into your calculation, that actually reflects the direction price moved, from your historical point. Implementing this will improve predictive power, especially when you begin running probability mapping. Simple predictive methods, to find next bar volatility and High and Low ranges/probable price points, you start by:
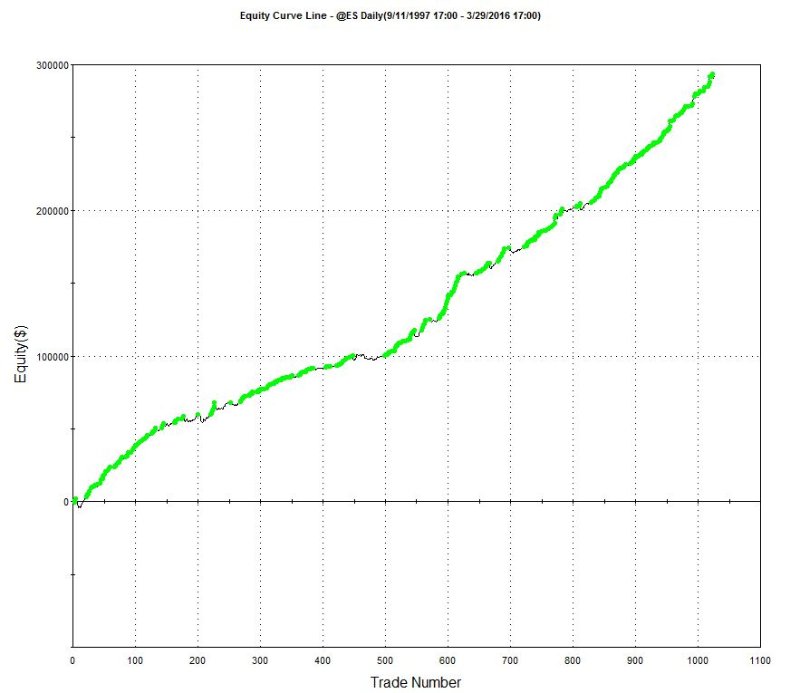
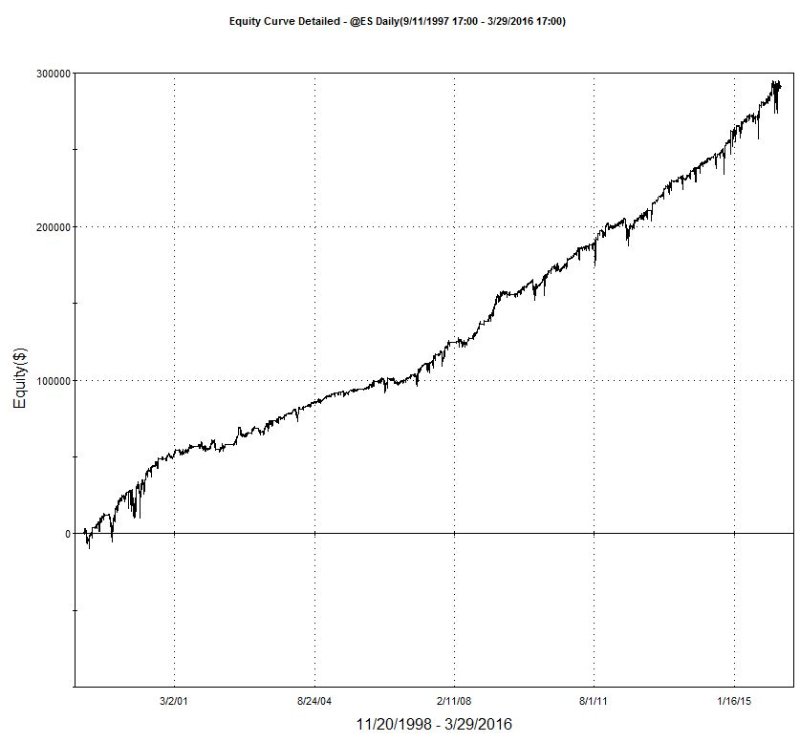
Then using these bits of info, you piece together a calculation that you apply to last bars close[0], if you want 1 bar projection. Or if your trading IOG, these values update intrabar. Take the avg's values, along with accel/decel to alter the projected values. You can average the calculation with historical avgs, or not...its up to you. Its also crucial to analyze multiple frequencies, and not gauge or make conclusions based off of a single time-series. Think of the market as a 3-d entity. You have to look at (Price, Volume, & Fundamentals) + Sentiment + Multiple frequencies We usually look at: 15min 45min 180min 360min Daily Weekly We develop systems for 15min 45min 135min 180min Daily Our research shows ES has a frequency strength of 42-48 mins, so we use 45min for ease... 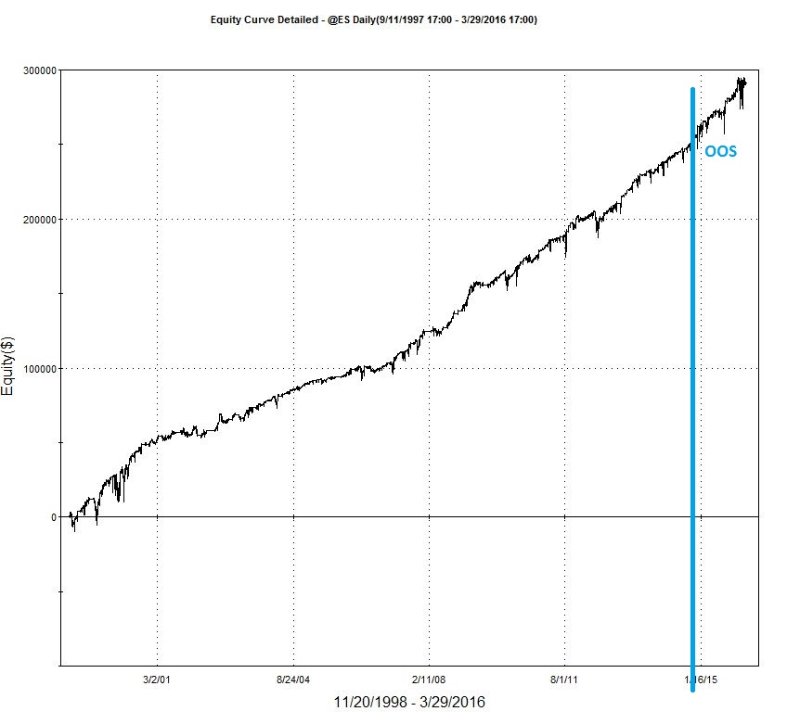 The graph above is of a GC model....(General Condition). This model was created in 11-2014, and its OOS performance has been >= historical ranges 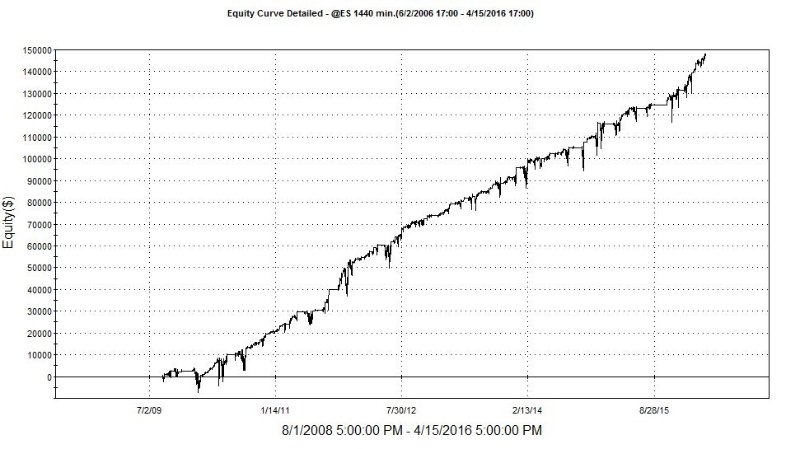 The graph above is of a Behavior specific model applied to 06-06 to 04-16. However the model begins trading in 08-2009. You can see how Risk metrics will usually be improved with a Behavior specific model, then with a GC model. Now, no matter the quality of your individual models/edges, and no matter how intelligent your control modules are....your going to experience losing trades, days, weeks, etc. The goal is to reduce those as much as possible, while also reducing the risk of strategic/systematic failure. When you focus on Risk mitigation and consistency....everything else will follow. Basically your "Extracting" the best parts of each model.....your only activating a model when its offering very robust performance. 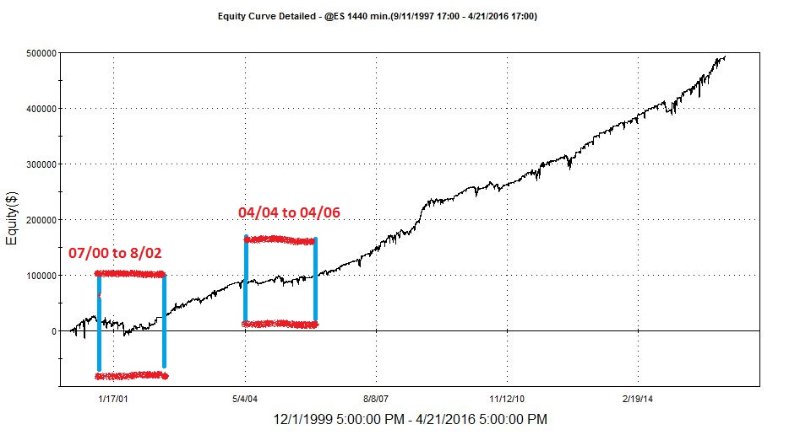 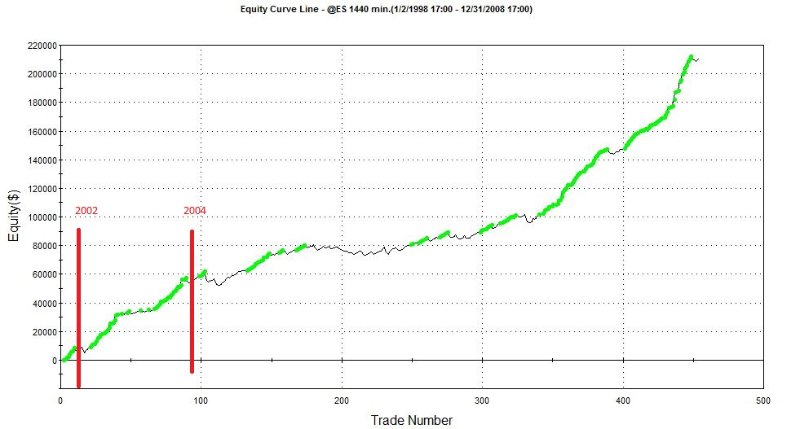 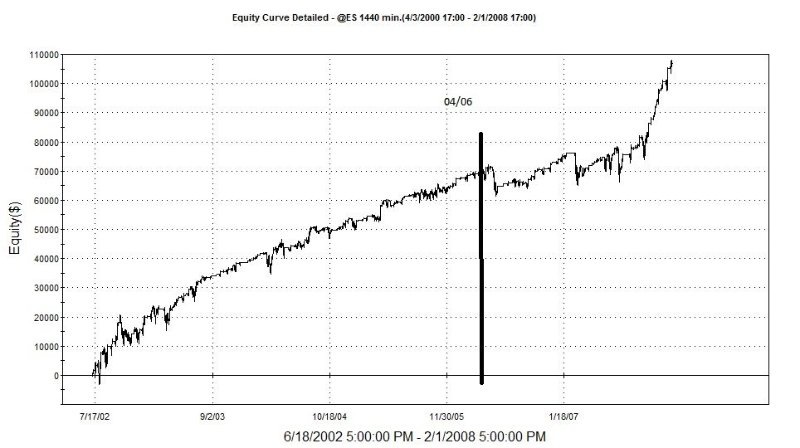 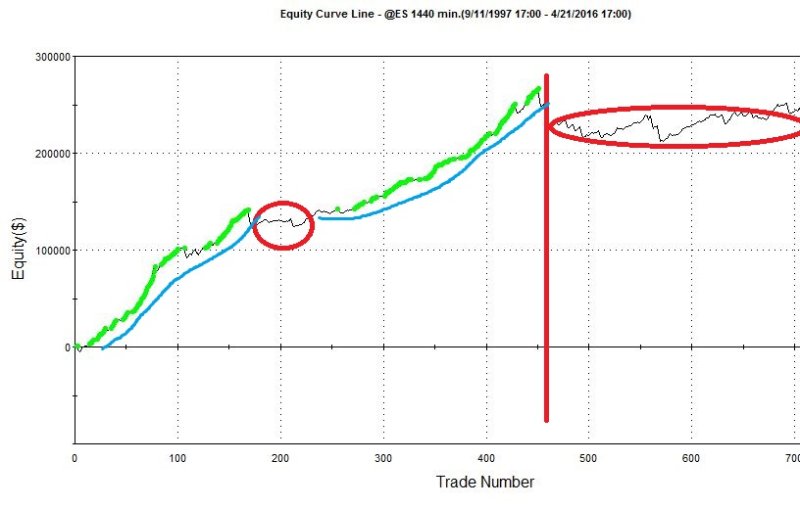 Here is a perfect example of a "Promising" edge blowing up in your face. Now the first 60% of this performance is pretty good, except for the time period of the first Red Circle, which could be easily solved by activating/trading a different model. However performance after the RedLine, is just horrible. My point, is you never know when a promising edge will fall out of favor, thus its not logical to rely on any perspective of singularity, no matter how "robust" it may have been historically or OOS. Here are some general example of GC(General Condition) models that we have as an option ton include within our Multi-Model systems. We try to keep all the concepts and performance as diversified as possible, while staying within the confines of each markets characteristics. 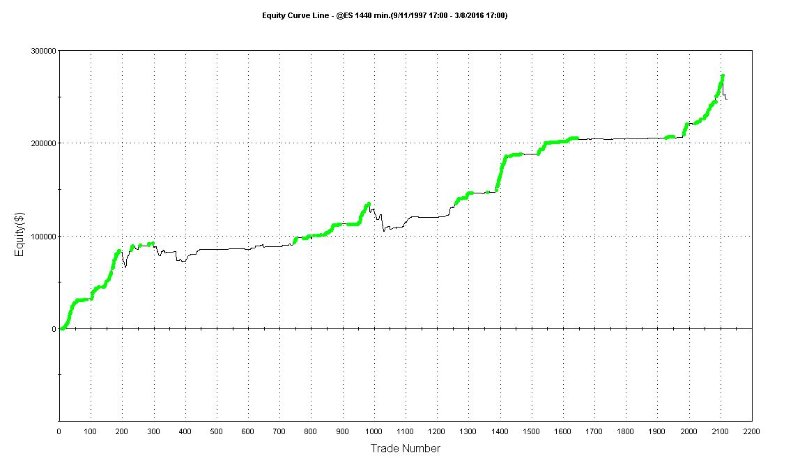 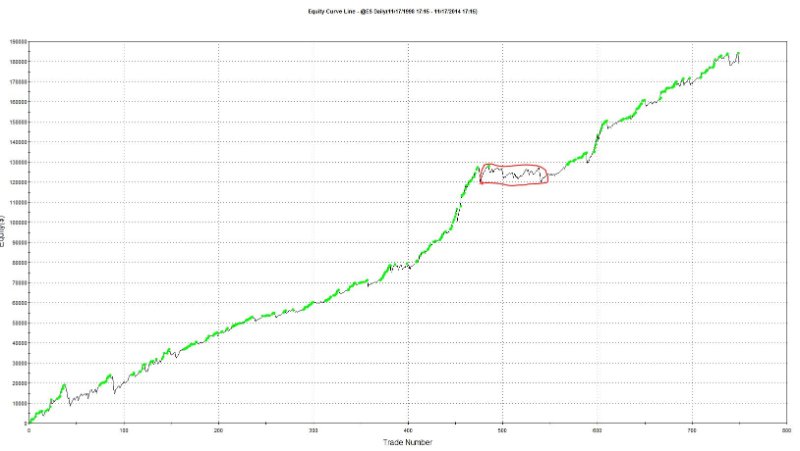 Graph above is of a single contract version, but I highlighted a period of time, in which this GC model would not have met/exceeded our performance requirements. 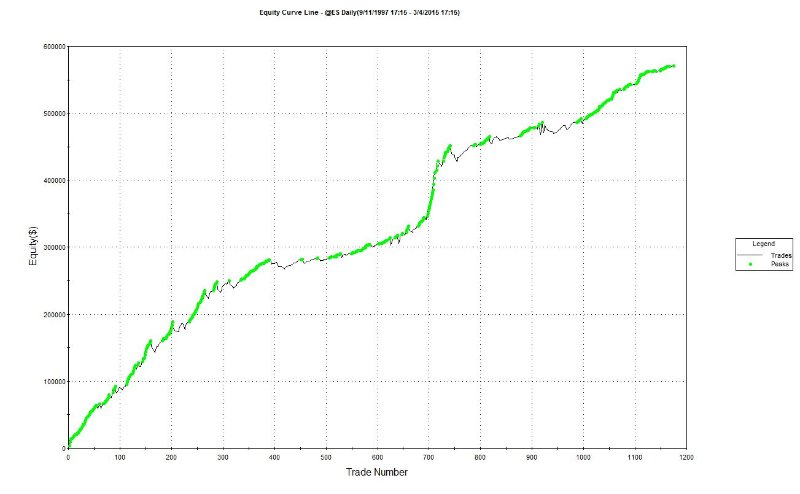 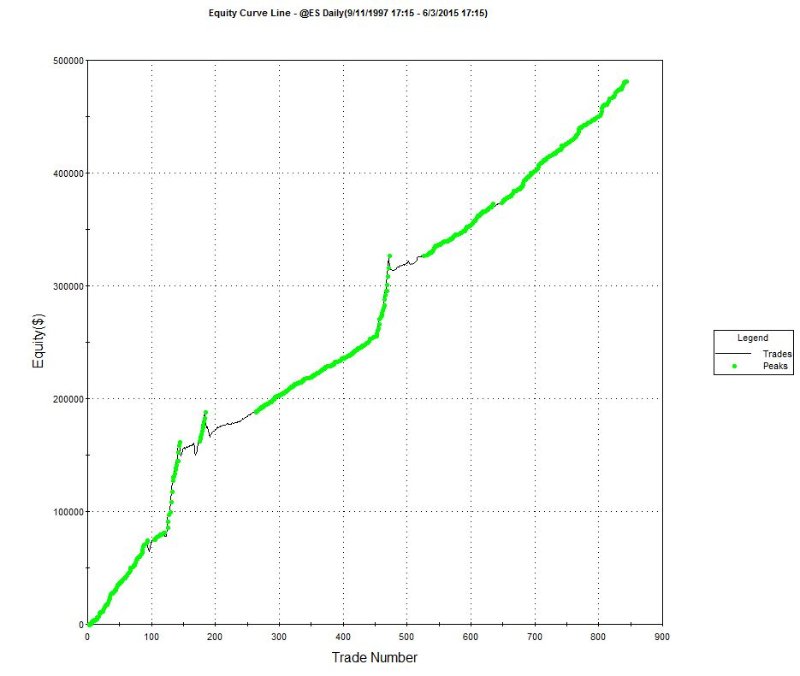 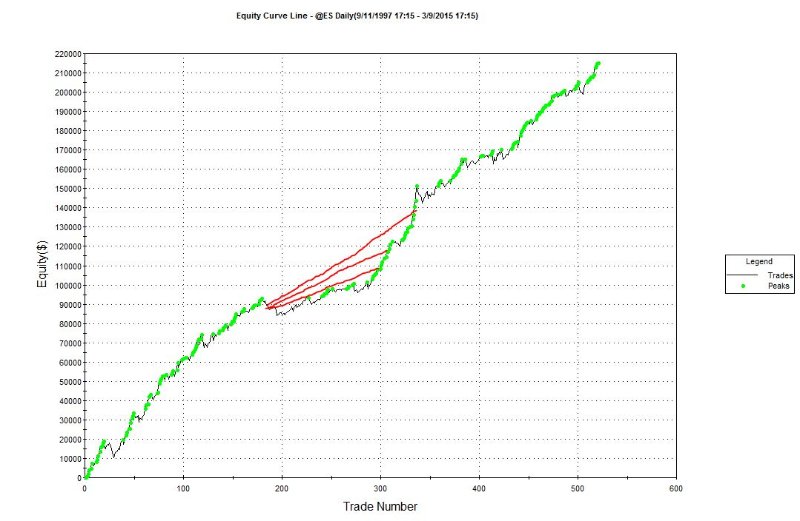 The Graph above if a Long Only model, and as you can see it goes through a 1 - 1.5 year period where the rate of growth was reduced. When you deploy multiple robust models, you can be as aggressive as you like, and seek to only activate models that offer Higher Return, rather than lower risk......its an option. 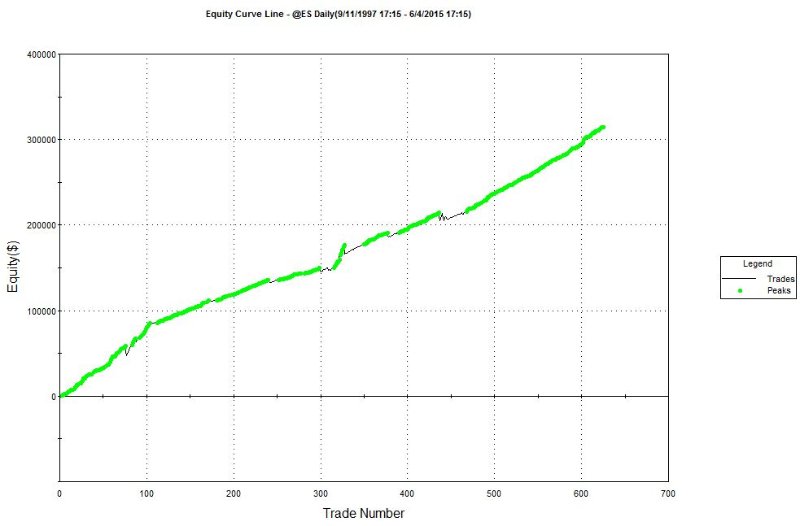 The graph above, is a perfect example of performance we prefer. We want consistent growth, with no major disruptions in ROG, with good trade frequency, and Low Deviations between Closed and Unrealized performance. 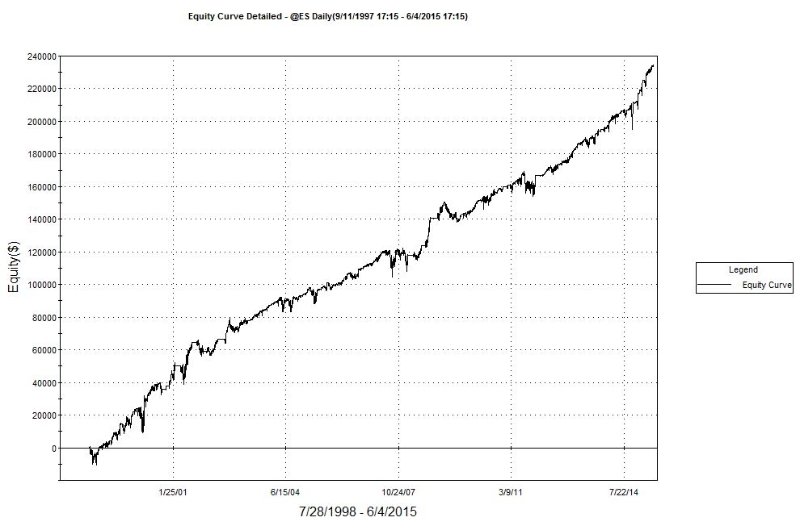 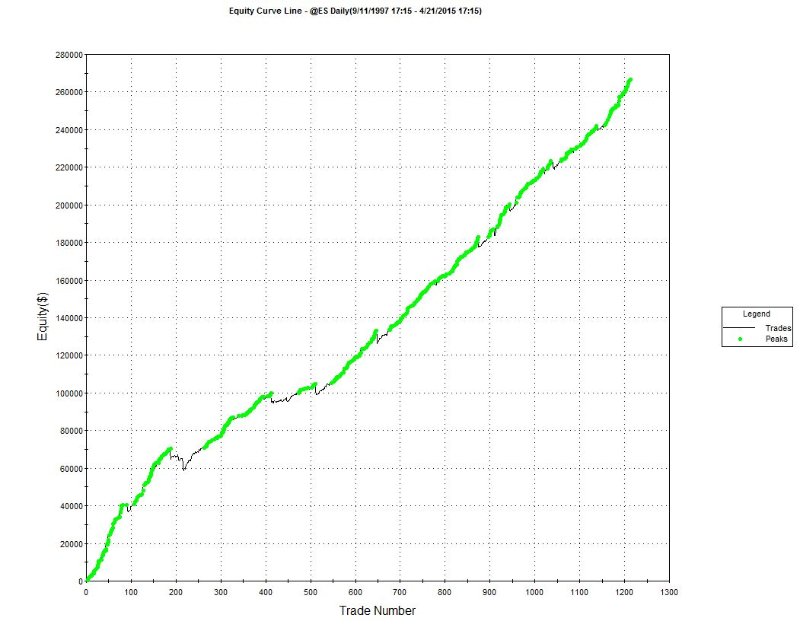 The graph above, is a Long Only model. When you develop a multi model systems. Model break-down/analysis is split into 3 categories:
   Finally and most important......stay in your lane. Meaning, never force a concept to work. Always work within the guidelines on the markets characteristics. EX: ES = Upward Bias / Drift + Strong Reverting Characteristics ( on multiple frequencies) Keeping the underlying strategic concept as simple as possible is vital, I would say creativity should be focused on more than complexity. Probably the simplest concept is looking for Divergence among Price and Volume, and playing off of the markets characteristics. Then allow for a few entries per position, and close on any Daily bar that closes profitable, and allow the position to work up to 5-6 days past the last entry. Since the ES has a very strong Daily and Weekly reverting characteristic/pattern, if you allow up to 5 entries, and allow 5 days to work, past the 5th entry.....if you make it that far before it closes profitably.....this simple concept performs quite well....for KISS. Just imagine if you really dive into the creative side of what the foundation has to offer. The tricky part is keeping Trade frequency high, + Good Profit Factor, + Low Deviations between Realized and Unrealized, so I always begin a search process for signals that has a quick validation time frame.....meaning the quicker it becomes profitable...the better. This way, once this initial/optimal validation period has passed, I can begin to initialize more adaptive/dynamic processes, such as syncing my Exit logic to time decay and momentum+volatility analysis. Because if it has not become profitable within YTime, I know the probability of it closing profitably continue to decline rapidly with each additional bar/hour/day/etc. Another option, is to find signals that may occur in sequence, and in certain time periods/frames. If signalABC occurs but it has a high occurrence that the third and fourth time it signals within XDays, the 3rd and 4th signal have a very quick validation period. So instead of allowing an entry to execute on the first or second signal.....you can only allow it to execute on the 3rd and 4th time its true. Sometimes its best to first allow simple logic to work.....then if and when your entry should require more attention, then allow more "intelligent / involved" processes to manage the position. The larger the frequency traded, the more difficult it is to deploy efficient time decay dynamic processes, but if you should combine a Daily + XMin frequencies into a single system, then use a 15min-180min bar for the micro analysis, this usually works best.....at least for our methods/concepts. Here is a generic graph, of the concept above, with NO....NO dynamic processes. Its just the basic entry statement/logic, with super simple/stagnant exit logic. Now there are some open position dips, but again, the strategy/model could NOT be more simple....trust me. My point, this is a brick...not the house. However this is trading ES Futures Daily bar (1440min), so the larger the frequency, the larger the open position risks....thats natural. Again, the cool and nerdy parts, is when you take this brick, and exploit it via smaller frequency (15min - 180min). Anything > 180min doest really create a big benefit, because the smaller freq must be beneath a certain size so you can deploy efficient time decay methods. TIME DECAY: Applying dynamic analysis/methods/processes, that initiate after some event, that begin to adapt your Profit and Loss Exit logic, or multiple entry logic, based on historical research + real-time volatility and momentum analysis. Allowing for constant adjustments/reductions/tightening of your Exit values, which improve the probabilities of allowing the position to exit as a winner winner chicken dinner....and/or reducing the Loss value. 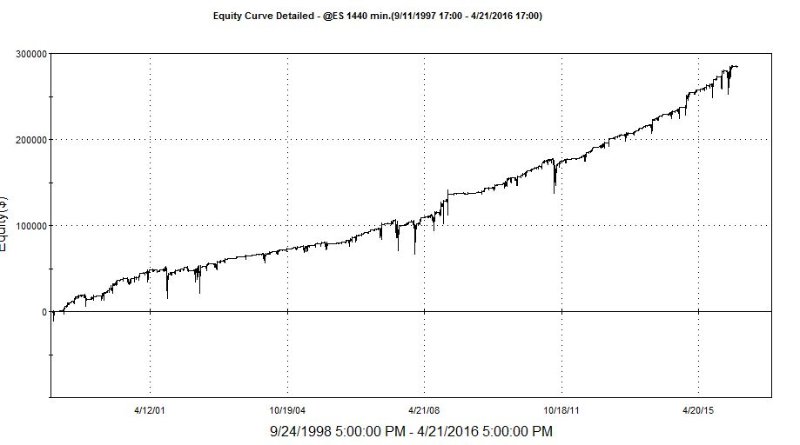 So you see.....quality performance can be achieved with simple constructs, it just requires a little insight, and not sticking to "Traditionalist" idealism of how or what a strategy and its processes should be......
I realize I given a few nuggets in this post, but I hope I have answered some questions and explained who we are as a firm....and the steps we take to design quality algorithms. Everyone has their own way of doing things, so there is no right or wrong way, so whatever works best for you...is best. I hope this post speaks a little about our conceptual philosophy and we feel its so important to never correlate Return or Risk to a single model, edge, bias, condition, etc. Optimized Trading's programs will be offered through our vast network of trading platforms & brokers. Please contact for additional details. We are only offering our systems as a monthly lease option via 3rd party providers. We do not and will not ever sell our systems outright, nor will we give clients access to our proprietary code/works. Eventually, once our website is operational(hopefully soon), we may offer an automated signal service, partnering with the major platforms and brokers, for our Stock and ETF systems. Good Luck on your never ending journey of discovery Brian Miller *Disclaimer: Historical performance whether live or simulated may not be indicative of future results. Trading Stocks, Options, FX, or Futures involves significant risks not suitable for all investors. Investors should only choose to invest funds he/she can afford to lose without impacting lifestyle. Price activity is not always predictable or repetitive, thus any strategy developed using historical data will be equally unpredictable. We do not guarantee our strategies or analysis methods will perform profitably and/or replicate results shown above, for any length of time. Before leasing/using our products, please consult your investment professionals, to discuss if our products are right for your risk tolerances & objectives. Price activity is not always repetitive or predictable, thus any strategy developed using historical data will be equally unpredictable.
0 Comments
Your comment will be posted after it is approved.
Leave a Reply. |
Archives
March 2018
Categories |
 RSS Feed